
YIELDMAX -- Yield + Capital Gain Analysis 5/15/2026
A more realistic view of current yield trends

As always, please read our disclaimer. Important!
If you want to skip right to the data, scroll down to the “Individual Stock Analysis” section below.
We just finished our April run!

Meaning it’s a great time to sign up for a paid subscription!
YieldMax’s Reverse Splits
Last year, YieldMax executed a massive reverse split across 15 of its products.
Rather than rehash the full discussion which we covered in detail here…

…we’ll simply note the practical issue: YieldMax has still not properly reverse-adjusted its dividend reporting — something most firms handle as a matter of course.
As a result, we are again skipping the affected products in this week’s analysis. They will not appear below.
Tickers excluded:
ABNY, AIYY, AMDY, CONY, CRSH, DIPS, FIAT, MRNY, MSTY, OARK, PYPY, TSLY, ULTY, XYZY, YBIT
The Current Yield Conundrum
We recently published a post on NAV erosion that directly addresses reverse-split dynamics in the covered-call ETF space.
No need to repeat it all here — but that post is worth reading:

The core point of the post is simple:
If an ETF pays massive distributions, that money must come from somewhere.
Covered-call ETFs are marketed as generating income from option premiums.
In practice, many also rely heavily on Return of Capital (ROC) — meaning part of the “distribution” is simply your own money being handed back to you to inflate the headline yield.
ROC functions a bit like a reverse mortgage:
You receive steady payments
The underlying asset slowly deteriorates
With a reverse mortgage, everyone understands the bank eventually owns the house.
With covered-call ETFs + ROC, many investors don’t realize the same dynamic can apply: principal can erode while the fund continues mailing out large checks.
Investors see huge yields and assume they’ll keep both:
their original investment
all that income
But if distributions are largely ROC, NAV can fall as fast as — or faster than — payouts.
The result? Eye-popping distributions… and still a negative total return.
Which brings us back to the main takeaway of the post:
Current yield isn’t necessarily what everyone thinks it is.
Do check out the post:
YieldMax General Info
Given the continued popularity of YieldMax, we’re continuing to evaluate all of their products based on a more meaningful metric:
Yield + Capital Gain
Almost all YieldMax funds have now transitioned to a weekly pay model. The only exceptions (for now) are:
BIGY
RNTY
SOXY
Those remain monthly payers.
We are keeping YieldMax separate from the broader weekly-payer universe — because covering 100+ stocks in one post is simply too much.
If you want to see the rest of the weekly payer universe, that is available here:

Analysis Tables
Here is some useful data:
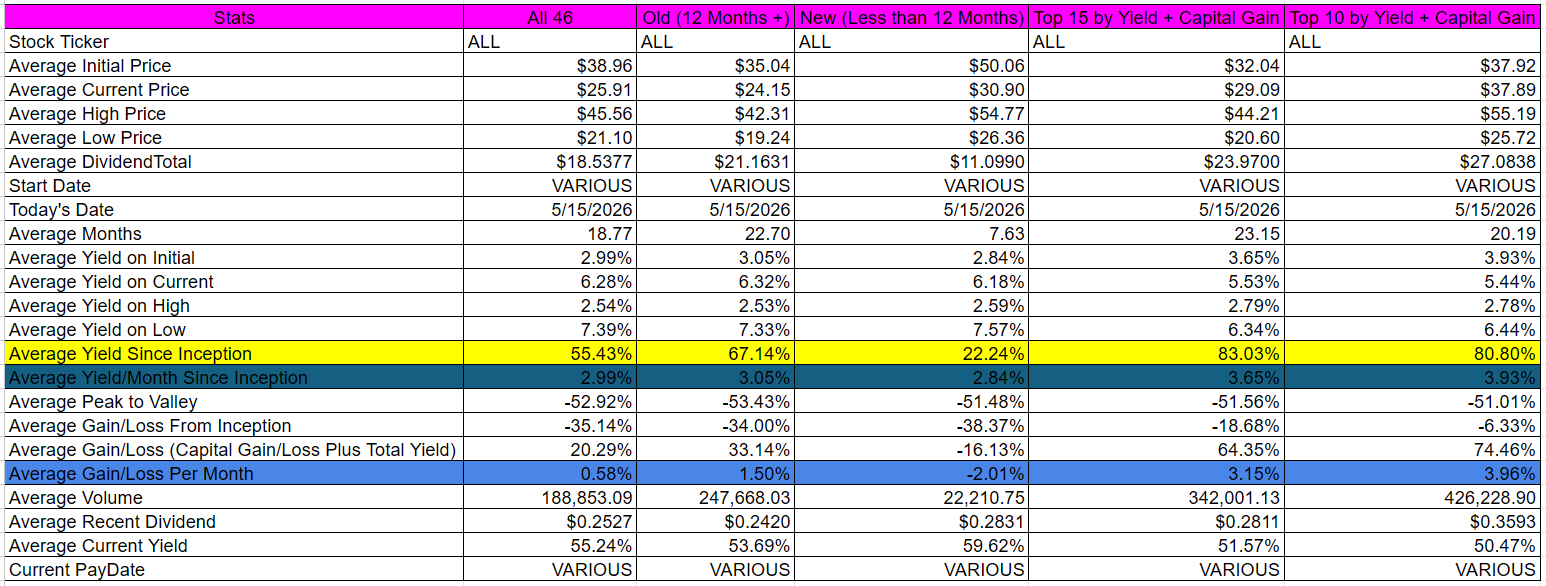
First, an averages table for all YieldMax products covered in this post. The columns in the table below from left-to-right are:
All 46 products
All products with GREATER than 12 months of performance history
All products with LESS than 12 months of performance history
Top 15 by yield + capital gain
Top 10 by yield + capital gain
Second, a Top 15 list by yield + capital gain normalized by months in existence:
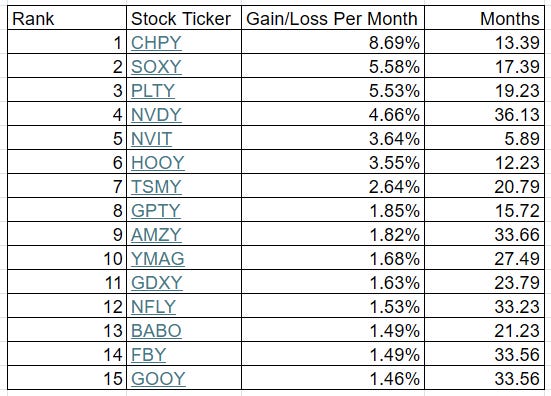
Important notes:
Figures in the Top 15 list are yield + capital gain normalized by months in existence
(Total yield + total capital gain) ÷ months since inception
This is NOT current yield
All data is calculated since inception
These reflect full historical records — not necessarily current trends
Dividends are calculated using the Ex-EFF Date
Support the Work
This is a free post.
If you find this analysis useful and want to see more of what we’re building, consider a paid subscription:
$5/month or $60/year
Also, as we mentioned above:
We just finished our April Run.
In other words… it’s a great time to sign up for a paid subscription.
Tons of dividend data.
Just $5/month:
Individual Stock Analysis (46 Entries)
In the list of individual stocks below, everything is sorted by descending yield + capital gain (bolded in each first paragraph). This is a far more useful metric than current yield alone.
Current yield is still listed — just not prioritized — and is listed in the second paragraph of each entry.
And before jumping headfirst into The River of Current Yield, make sure to read the full first paragraph of each entry.
Fair warning.
Occasionally, we may hold positions in some of these stocks.
[1] YieldMax Semiconductor Portfolio Option Income ETF [CHPY]
CHPY had total dividends of $25.2912 from 4/3/2025 to 5/15/2026. It has been active for 13.39 months. During that time frame it had a starting price of $45.65, a high price of $76.39, a low price of $40.40, and a 5/15/2026 price of $73.50. This means that it had a yield of 55.40%, or an average monthly yield of 4.14%. The peak-to-valley is -47.11%. The capital gains were 61.01%. The overall gain/loss (cap gains + yield) is 116.41%, or a gain/loss per month of 8.69%. The average volume since inception was 176,231.
CHPY received a recent dividend of $0.6629 on 5/14/2026. This means the current yield ($0.6629 / $73.50 * weeks/months per year paid) is 46.90%.
[2] YieldMax Target 12 Semiconductor Option Inc ETF [SOXY]
SOXY had total dividends of $9.6481 from 12/3/2024 to 5/15/2026. It has been active for 17.39 months. During that time frame it had a starting price of $50.10, a high price of $92.68, a low price of $35.02, and a 5/15/2026 price of $89.09. This means that it had a yield of 19.26%, or an average monthly yield of 1.11%. The peak-to-valley is -62.21%. The capital gains were 77.82%. The overall gain/loss (cap gains + yield) is 97.08%, or a gain/loss per month of 5.58%. The average volume since inception was 7,073.
SOXY received a recent dividend of $0.8297 on 5/7/2026. This means the current yield ($0.8297 / $89.09 * weeks/months per year paid) is 11.18%.
[3] YieldMax PLTR Option Income Strategy ETF [PLTY]
PLTY had total dividends of $72.4283 from 10/8/2024 to 5/15/2026. It has been active for 19.23 months. During that time frame it had a starting price of $51.43, a high price of $95.08, a low price of $32.30, and a 5/15/2026 price of $33.72. This means that it had a yield of 140.83%, or an average monthly yield of 7.32%. The peak-to-valley is -66.03%. The capital gains were -34.44%. The overall gain/loss (cap gains + yield) is 106.39%, or a gain/loss per month of 5.53%. The average volume since inception was 308,790.
PLTY received a recent dividend of $0.4361 on 5/15/2026. This means the current yield ($0.4361 / $33.72 * weeks/months per year paid) is 67.25%.
[4] YieldMax NVDA Option Income Strategy ETF [NVDY]
NVDY had total dividends of $39.1229 from 5/11/2023 to 5/15/2026. It has been active for 36.13 months. During that time frame it had a starting price of $19.91, a high price of $31.77, a low price of $12.34, and a 5/15/2026 price of $14.34. This means that it had a yield of 196.50%, or an average monthly yield of 5.44%. The peak-to-valley is -61.16%. The capital gains were -27.98%. The overall gain/loss (cap gains + yield) is 168.52%, or a gain/loss per month of 4.66%. The average volume since inception was 2,508,621.
NVDY received a recent dividend of $0.1509 on 5/15/2026. This means the current yield ($0.1509 / $14.34 * weeks/months per year paid) is 54.72%.
[5] YieldMax NVDA Performance Distribution Target 25 ETF [NVIT]
NVIT had total dividends of $5.6324 from 11/18/2025 to 5/15/2026. It has been active for 5.89 months. During that time frame it had a starting price of $49.25, a high price of $56.26, a low price of $44.20, and a 5/15/2026 price of $54.16. This means that it had a yield of 11.44%, or an average monthly yield of 1.94%. The peak-to-valley is -21.44%. The capital gains were 9.97%. The overall gain/loss (cap gains + yield) is 21.41%, or a gain/loss per month of 3.64%. The average volume since inception was 4,400.
NVIT received a recent dividend of $0.2514 on 5/13/2026. This means the current yield ($0.2514 / $54.16 * weeks/months per year paid) is 24.14%.
[6] YieldMax HOOD Option Income Strategy ETF [HOOY]
HOOY had total dividends of $48.1248 from 5/8/2025 to 5/15/2026. It has been active for 12.23 months. During that time frame it had a starting price of $52.82, a high price of $80.99, a low price of $25.85, and a 5/15/2026 price of $27.65. This means that it had a yield of 91.11%, or an average monthly yield of 7.45%. The peak-to-valley is -68.08%. The capital gains were -47.65%. The overall gain/loss (cap gains + yield) is 43.46%, or a gain/loss per month of 3.55%. The average volume since inception was 173,904.
HOOY received a recent dividend of $0.4340 on 5/15/2026. This means the current yield ($0.4340 / $27.65 * weeks/months per year paid) is 81.62%.
[7] YieldMax TSM Option Income Strategy ETF [TSMY]
TSMY had total dividends of $14.5192 from 8/21/2024 to 5/15/2026. It has been active for 20.79 months. During that time frame it had a starting price of $20.03, a high price of $22.31, a low price of $12.10, and a 5/15/2026 price of $16.52. This means that it had a yield of 72.49%, or an average monthly yield of 3.49%. The peak-to-valley is -45.76%. The capital gains were -17.52%. The overall gain/loss (cap gains + yield) is 54.96%, or a gain/loss per month of 2.64%. The average volume since inception was 100,705.
TSMY received a recent dividend of $0.1789 on 5/15/2026. This means the current yield ($0.1789 / $16.52 * weeks/months per year paid) is 56.31%.
[8] YieldMax AI & Tech Portfolio Option Income ETF [GPTY]
GPTY had total dividends of $19.8412 from 1/23/2025 to 5/15/2026. It has been active for 15.72 months. During that time frame it had a starting price of $50.09, a high price of $50.43, a low price of $32.92, and a 5/15/2026 price of $44.78. This means that it had a yield of 39.61%, or an average monthly yield of 2.52%. The peak-to-valley is -34.72%. The capital gains were -10.60%. The overall gain/loss (cap gains + yield) is 29.01%, or a gain/loss per month of 1.85%. The average volume since inception was 36,660.
GPTY received a recent dividend of $0.3555 on 5/14/2026. This means the current yield ($0.3555 / $44.78 * weeks/months per year paid) is 41.28%.
[9] YieldMax AMZN Option Income Strategy ETF [AMZY]
AMZY had total dividends of $20.1764 from 7/25/2023 to 5/15/2026. It has been active for 33.66 months. During that time frame it had a starting price of $20.05, a high price of $24.10, a low price of $10.61, and a 5/15/2026 price of $12.17. This means that it had a yield of 100.63%, or an average monthly yield of 2.99%. The peak-to-valley is -55.98%. The capital gains were -39.30%. The overall gain/loss (cap gains + yield) is 61.33%, or a gain/loss per month of 1.82%. The average volume since inception was 284,394.
AMZY received a recent dividend of $0.1437 on 5/15/2026. This means the current yield ($0.1437 / $12.17 * weeks/months per year paid) is 61.40%.
[10] YieldMax Magnificent 7 Fund of Option Income ETFs [YMAG]
YMAG had total dividends of $16.0530 from 1/30/2024 to 5/15/2026. It has been active for 27.49 months. During that time frame it had a starting price of $19.89, a high price of $21.91, a low price of $11.47, and a 5/15/2026 price of $13.00. This means that it had a yield of 80.71%, or an average monthly yield of 2.94%. The peak-to-valley is -47.65%. The capital gains were -34.64%. The overall gain/loss (cap gains + yield) is 46.07%, or a gain/loss per month of 1.68%. The average volume since inception was 661,511.
YMAG received a recent dividend of $0.1497 on 5/14/2026. This means the current yield ($0.1497 / $13.00 * weeks/months per year paid) is 59.88%.
[11] YieldMax Gold Miners Option Income Strategy ETF [GDXY]
GDXY had total dividends of $15.1390 from 5/21/2024 to 5/15/2026. It has been active for 23.79 months. During that time frame it had a starting price of $19.85, a high price of $19.98, a low price of $12.29, and a 5/15/2026 price of $12.40. This means that it had a yield of 76.27%, or an average monthly yield of 3.21%. The peak-to-valley is -38.49%. The capital gains were -37.53%. The overall gain/loss (cap gains + yield) is 38.74%, or a gain/loss per month of 1.63%. The average volume since inception was 358,167.
GDXY received a recent dividend of $0.1247 on 5/15/2026. This means the current yield ($0.1247 / $12.40 * weeks/months per year paid) is 52.29%.
[12] YieldMax NFLX Option Income Strategy ETF [NFLY]
NFLY had total dividends of $20.5609 from 8/8/2023 to 5/15/2026. It has been active for 33.23 months. During that time frame it had a starting price of $19.99, a high price of $20.36, a low price of $9.41, and a 5/15/2026 price of $9.60. This means that it had a yield of 102.86%, or an average monthly yield of 3.10%. The peak-to-valley is -53.78%. The capital gains were -51.98%. The overall gain/loss (cap gains + yield) is 50.88%, or a gain/loss per month of 1.53%. The average volume since inception was 127,297.
NFLY received a recent dividend of $0.0737 on 5/15/2026. This means the current yield ($0.0737 / $9.60 * weeks/months per year paid) is 39.92%.
[13] YieldMax BABA Option Income Strategy ETF [BABO]
BABO had total dividends of $16.8787 from 8/8/2024 to 5/15/2026. It has been active for 21.23 months. During that time frame it had a starting price of $20.42, a high price of $25.53, a low price of $9.79, and a 5/15/2026 price of $10.02. This means that it had a yield of 82.66%, or an average monthly yield of 3.89%. The peak-to-valley is -61.65%. The capital gains were -50.93%. The overall gain/loss (cap gains + yield) is 31.73%, or a gain/loss per month of 1.49%. The average volume since inception was 72,148.
BABO received a recent dividend of $0.1015 on 5/15/2026. This means the current yield ($0.1015 / $10.02 * weeks/months per year paid) is 52.67%.
[14] YieldMax META Option Income Strategy ETF [FBY]
FBY had total dividends of $20.7984 from 7/28/2023 to 5/15/2026. It has been active for 33.56 months. During that time frame it had a starting price of $20.63, a high price of $24.49, a low price of $9.40, and a 5/15/2026 price of $10.16. This means that it had a yield of 100.82%, or an average monthly yield of 3.00%. The peak-to-valley is -61.62%. The capital gains were -50.75%. The overall gain/loss (cap gains + yield) is 50.06%, or a gain/loss per month of 1.49%. The average volume since inception was 127,431.
FBY received a recent dividend of $0.0800 on 5/15/2026. This means the current yield ($0.0800 / $10.16 * weeks/months per year paid) is 40.94%.
[15] YieldMax GOOGL Option Income Strategy ETF [GOOY]
GOOY had total dividends of $15.3355 from 7/28/2023 to 5/15/2026. It has been active for 33.56 months. During that time frame it had a starting price of $20.50, a high price of $20.83, a low price of $10.89, and a 5/15/2026 price of $15.24. This means that it had a yield of 74.81%, or an average monthly yield of 2.23%. The peak-to-valley is -47.72%. The capital gains were -25.66%. The overall gain/loss (cap gains + yield) is 49.15%, or a gain/loss per month of 1.46%. The average volume since inception was 182,685.
GOOY received a recent dividend of $0.2433 on 5/15/2026. This means the current yield ($0.2433 / $15.24 * weeks/months per year paid) is 83.02%.
[16] YieldMax CVNA Option Income Strategy ETF [CVNY]
CVNY had total dividends of $37.3163 from 1/30/2025 to 5/15/2026. It has been active for 15.49 months. During that time frame it had a starting price of $50.00, a high price of $58.17, a low price of $22.07, and a 5/15/2026 price of $23.69. This means that it had a yield of 74.63%, or an average monthly yield of 4.82%. The peak-to-valley is -62.06%. The capital gains were -52.62%. The overall gain/loss (cap gains + yield) is 22.01%, or a gain/loss per month of 1.42%. The average volume since inception was 59,607.
CVNY received a recent dividend of $0.5050 on 5/15/2026. This means the current yield ($0.5050 / $23.69 * weeks/months per year paid) is 110.85%.
[17] YieldMax Target 12 Big 50 Option Income ETF [BIGY]
BIGY had total dividends of $8.6091 from 11/21/2024 to 5/15/2026. It has been active for 17.79 months. During that time frame it had a starting price of $50.15, a high price of $54.64, a low price of $40.00, and a 5/15/2026 price of $52.92. This means that it had a yield of 17.17%, or an average monthly yield of 0.97%. The peak-to-valley is -26.79%. The capital gains were 5.52%. The overall gain/loss (cap gains + yield) is 22.69%, or a gain/loss per month of 1.28%. The average volume since inception was 7,185.
BIGY received a recent dividend of $0.5213 on 5/7/2026. This means the current yield ($0.5213 / $52.92 * weeks/months per year paid) is 11.82%.
[18] YieldMax Russell 2000 0DTE Covered Call Strat ETF [RDTY]
RDTY had total dividends of $19.9698 from 3/6/2025 to 5/15/2026. It has been active for 14.3 months. During that time frame it had a starting price of $49.21, a high price of $50.07, a low price of $35.11, and a 5/15/2026 price of $37.80. This means that it had a yield of 40.58%, or an average monthly yield of 2.84%. The peak-to-valley is -29.88%. The capital gains were -23.19%. The overall gain/loss (cap gains + yield) is 17.39%, or a gain/loss per month of 1.22%. The average volume since inception was 11,216.
RDTY received a recent dividend of $0.2449 on 5/14/2026. This means the current yield ($0.2449 / $37.80 * weeks/months per year paid) is 33.69%.
[19] YieldMax SNOW Option Income Strategy ETF [SNOY]
SNOY had total dividends of $18.0717 from 6/11/2024 to 5/15/2026. It has been active for 23.13 months. During that time frame it had a starting price of $20.18, a high price of $23.76, a low price of $6.17, and a 5/15/2026 price of $7.34. This means that it had a yield of 89.55%, or an average monthly yield of 3.87%. The peak-to-valley is -74.03%. The capital gains were -63.63%. The overall gain/loss (cap gains + yield) is 25.93%, or a gain/loss per month of 1.12%. The average volume since inception was 111,649.
SNOY received a recent dividend of $0.1500 on 5/15/2026. This means the current yield ($0.1500 / $7.34 * weeks/months per year paid) is 106.27%.
[20] YieldMax Nasdaq 100 0DTE Covered Call Strategy ETF [QDTY]
QDTY had total dividends of $16.7377 from 2/13/2025 to 5/15/2026. It has been active for 15.07 months. During that time frame it had a starting price of $50.61, a high price of $52.55, a low price of $36.36, and a 5/15/2026 price of $41.93. This means that it had a yield of 33.07%, or an average monthly yield of 2.20%. The peak-to-valley is -30.81%. The capital gains were -17.15%. The overall gain/loss (cap gains + yield) is 15.92%, or a gain/loss per month of 1.06%. The average volume since inception was 12,121.
QDTY received a recent dividend of $0.2256 on 5/14/2026. This means the current yield ($0.2256 / $41.93 * weeks/months per year paid) is 27.98%.
[21] YieldMax MSFT Option Income Strategy ETF [MSFO]
MSFO had total dividends of $14.7628 from 8/25/2023 to 5/15/2026. It has been active for 32.66 months. During that time frame it had a starting price of $20.18, a high price of $23.48, a low price of $11.14, and a 5/15/2026 price of $12.29. This means that it had a yield of 73.16%, or an average monthly yield of 2.24%. The peak-to-valley is -52.56%. The capital gains were -39.10%. The overall gain/loss (cap gains + yield) is 34.06%, or a gain/loss per month of 1.04%. The average volume since inception was 71,751.
MSFO received a recent dividend of $0.1423 on 5/15/2026. This means the current yield ($0.1423 / $12.29 * weeks/months per year paid) is 60.21%.
[22] YieldMax Universe Fund of Option Income ETFs [YMAX]
YMAX had total dividends of $16.9106 from 1/17/2024 to 5/15/2026. It has been active for 27.92 months. During that time frame it had a starting price of $19.90, a high price of $21.94, a low price of $7.47, and a 5/15/2026 price of $8.45. This means that it had a yield of 84.98%, or an average monthly yield of 3.04%. The peak-to-valley is -65.95%. The capital gains were -57.54%. The overall gain/loss (cap gains + yield) is 27.44%, or a gain/loss per month of 0.98%. The average volume since inception was 1,460,263.
YMAX received a recent dividend of $0.0930 on 5/14/2026. This means the current yield ($0.0930 / $8.45 * weeks/months per year paid) is 57.23%.
[23] YieldMax JP Option Income Strategy ETF [JPO]
JPO had total dividends of $12.5333 from 9/12/2023 to 5/15/2026. It has been active for 32.1 months. During that time frame it had a starting price of $20.06, a high price of $22.30, a low price of $13.32, and a 5/15/2026 price of $13.51. This means that it had a yield of 62.48%, or an average monthly yield of 1.95%. The peak-to-valley is -40.27%. The capital gains were -32.65%. The overall gain/loss (cap gains + yield) is 29.83%, or a gain/loss per month of 0.93%. The average volume since inception was 30,848.
JPO received a recent dividend of $0.0647 on 5/15/2026. This means the current yield ($0.0647 / $13.51 * weeks/months per year paid) is 24.90%.
[24] YieldMax S&P 500 0DTE Covered Call Strategy ETF [SDTY]
SDTY had total dividends of $14.2488 from 2/6/2025 to 5/15/2026. It has been active for 15.3 months. During that time frame it had a starting price of $50.29, a high price of $51.29, a low price of $38.59, and a 5/15/2026 price of $42.42. This means that it had a yield of 28.33%, or an average monthly yield of 1.85%. The peak-to-valley is -24.76%. The capital gains were -15.65%. The overall gain/loss (cap gains + yield) is 12.68%, or a gain/loss per month of 0.83%. The average volume since inception was 11,153.
SDTY received a recent dividend of $0.2105 on 5/14/2026. This means the current yield ($0.2105 / $42.42 * weeks/months per year paid) is 25.80%.
[25] YieldMax AAPL Option Income Strategy ETF [APLY]
APLY had total dividends of $13.4577 from 4/18/2023 to 5/15/2026. It has been active for 36.89 months. During that time frame it had a starting price of $20.20, a high price of $23.02, a low price of $11.36, and a 5/15/2026 price of $12.63. This means that it had a yield of 66.62%, or an average monthly yield of 1.81%. The peak-to-valley is -50.65%. The capital gains were -37.48%. The overall gain/loss (cap gains + yield) is 29.15%, or a gain/loss per month of 0.79%. The average volume since inception was 100,647.
APLY received a recent dividend of $0.1205 on 5/15/2026. This means the current yield ($0.1205 / $12.63 * weeks/months per year paid) is 49.61%.
[26] YieldMax MSTR Short Option Income Strategy ETF [WNTR]
WNTR had total dividends of $33.0309 from 3/27/2025 to 5/15/2026. It has been active for 13.59 months. During that time frame it had a starting price of $50.06, a high price of $60.64, a low price of $20.85, and a 5/15/2026 price of $22.25. This means that it had a yield of 65.98%, or an average monthly yield of 4.85%. The peak-to-valley is -65.62%. The capital gains were -55.55%. The overall gain/loss (cap gains + yield) is 10.43%, or a gain/loss per month of 0.77%. The average volume since inception was 140,662.
WNTR received a recent dividend of $0.2742 on 5/15/2026. This means the current yield ($0.2742 / $22.25 * weeks/months per year paid) is 64.08%.
[27] YieldMax TSLA Performance Distribution Target 25 ETF [TEST]
TEST had total dividends of $5.6039 from 11/18/2025 to 5/15/2026. It has been active for 5.89 months. During that time frame it had a starting price of $49.66, a high price of $57.74, a low price of $40.27, and a 5/15/2026 price of $46.14. This means that it had a yield of 11.28%, or an average monthly yield of 1.92%. The peak-to-valley is -30.26%. The capital gains were -7.09%. The overall gain/loss (cap gains + yield) is 4.20%, or a gain/loss per month of 0.71%. The average volume since inception was 1,957.
TEST received a recent dividend of $0.2193 on 5/13/2026. This means the current yield ($0.2193 / $46.14 * weeks/months per year paid) is 24.72%.
[28] YieldMax Target 12 Real Estate Option Income ETF [RNTY]
RNTY had total dividends of $6.0641 from 4/17/2025 to 5/15/2026. It has been active for 12.92 months. During that time frame it had a starting price of $50.86, a high price of $53.02, a low price of $47.67, and a 5/15/2026 price of $49.20. This means that it had a yield of 11.92%, or an average monthly yield of 0.92%. The peak-to-valley is -10.09%. The capital gains were -3.26%. The overall gain/loss (cap gains + yield) is 8.66%, or a gain/loss per month of 0.67%. The average volume since inception was 6,648.
RNTY received a recent dividend of $0.5068 on 5/7/2026. This means the current yield ($0.5068 / $49.20 * weeks/months per year paid) is 12.36%.
[29] YieldMax DIS Option Income Strategy ETF [DISO]
DISO had total dividends of $13.6607 from 8/25/2023 to 5/15/2026. It has been active for 32.66 months. During that time frame it had a starting price of $20.16, a high price of $22.69, a low price of $9.53, and a 5/15/2026 price of $9.81. This means that it had a yield of 67.76%, or an average monthly yield of 2.07%. The peak-to-valley is -58.00%. The capital gains were -51.34%. The overall gain/loss (cap gains + yield) is 16.42%, or a gain/loss per month of 0.50%. The average volume since inception was 16,902.
DISO received a recent dividend of $0.0866 on 5/15/2026. This means the current yield ($0.0866 / $9.81 * weeks/months per year paid) is 45.90%.
[30] YieldMax XOM Option Income Strategy ETF [XOMO]
XOMO had total dividends of $10.3677 from 8/31/2023 to 5/15/2026. It has been active for 32.46 months. During that time frame it had a starting price of $20.01, a high price of $23.38, a low price of $11.32, and a 5/15/2026 price of $12.20. This means that it had a yield of 51.81%, or an average monthly yield of 1.60%. The peak-to-valley is -51.58%. The capital gains were -39.03%. The overall gain/loss (cap gains + yield) is 12.78%, or a gain/loss per month of 0.39%. The average volume since inception was 57,148.
XOMO received a recent dividend of $0.0809 on 5/15/2026. This means the current yield ($0.0809 / $12.20 * weeks/months per year paid) is 34.48%.
[31] YieldMax Crypto Industry & Tech Port Opt Inc ETF [LFGY]
LFGY had total dividends of $28.2886 from 1/14/2025 to 5/15/2026. It has been active for 16.03 months. During that time frame it had a starting price of $51.25, a high price of $55.11, a low price of $18.83, and a 5/15/2026 price of $23.79. This means that it had a yield of 55.20%, or an average monthly yield of 3.44%. The peak-to-valley is -65.83%. The capital gains were -53.58%. The overall gain/loss (cap gains + yield) is 1.62%, or a gain/loss per month of 0.10%. The average volume since inception was 128,687.
LFGY received a recent dividend of $0.2635 on 5/14/2026. This means the current yield ($0.2635 / $23.79 * weeks/months per year paid) is 57.60%.
[32] YieldMax BRK B Option Income Strategy ETF [BRKC]
BRKC had total dividends of $7.7827 from 6/5/2025 to 5/15/2026. It has been active for 11.33 months. During that time frame it had a starting price of $49.68, a high price of $50.66, a low price of $40.24, and a 5/15/2026 price of $40.97. This means that it had a yield of 15.67%, or an average monthly yield of 1.38%. The peak-to-valley is -20.57%. The capital gains were -17.53%. The overall gain/loss (cap gains + yield) is -1.87%, or a gain/loss per month of -0.16%. The average volume since inception was 14,856.
BRKC received a recent dividend of $0.1526 on 5/15/2026. This means the current yield ($0.1526 / $40.97 * weeks/months per year paid) is 19.37%.
[33] YieldMax Short N100 Option Income Strategy ETF [YQQQ]
YQQQ had total dividends of $6.4127 from 8/15/2024 to 5/15/2026. It has been active for 21 months. During that time frame it had a starting price of $19.64, a high price of $20.55, a low price of $10.21, and a 5/15/2026 price of $10.38. This means that it had a yield of 32.65%, or an average monthly yield of 1.55%. The peak-to-valley is -50.32%. The capital gains were -47.15%. The overall gain/loss (cap gains + yield) is -14.50%, or a gain/loss per month of -0.69%. The average volume since inception was 44,480.
YQQQ received a recent dividend of $0.0435 on 5/15/2026. This means the current yield ($0.0435 / $10.38 * weeks/months per year paid) is 21.79%.
[34] YieldMax Dorsey Wright Hybrid 5 Income ETF [FIVY]
FIVY had total dividends of $17.5529 from 12/17/2024 to 5/15/2026. It has been active for 16.92 months. During that time frame it had a starting price of $49.78, a high price of $52.51, a low price of $22.23, and a 5/15/2026 price of $26.27. This means that it had a yield of 35.26%, or an average monthly yield of 2.08%. The peak-to-valley is -57.67%. The capital gains were -47.23%. The overall gain/loss (cap gains + yield) is -11.97%, or a gain/loss per month of -0.71%. The average volume since inception was 9,046.
FIVY received a recent dividend of $0.2032 on 5/14/2026. This means the current yield ($0.2032 / $26.27 * weeks/months per year paid) is 40.22%.
[35] YieldMax Dorsey Wright Featured 5 Income ETF [FEAT]
FEAT had total dividends of $23.4981 from 12/17/2024 to 5/15/2026. It has been active for 16.92 months. During that time frame it had a starting price of $49.71, a high price of $50.21, a low price of $17.30, and a 5/15/2026 price of $19.51. This means that it had a yield of 47.27%, or an average monthly yield of 2.79%. The peak-to-valley is -65.54%. The capital gains were -60.75%. The overall gain/loss (cap gains + yield) is -13.48%, or a gain/loss per month of -0.80%. The average volume since inception was 23,432.
FEAT received a recent dividend of $0.2643 on 5/14/2026. This means the current yield ($0.2643 / $19.51 * weeks/months per year paid) is 70.44%.
[36] YieldMax SMCI Option Income Strategy ETF [SMCY]
SMCY had total dividends of $30.7381 from 9/12/2024 to 5/15/2026. It has been active for 20.1 months. During that time frame it had a starting price of $50.62, a high price of $59.20, a low price of $4.80, and a 5/15/2026 price of $6.10. This means that it had a yield of 60.72%, or an average monthly yield of 3.02%. The peak-to-valley is -91.89%. The capital gains were -87.95%. The overall gain/loss (cap gains + yield) is -27.23%, or a gain/loss per month of -1.35%. The average volume since inception was 785,679.
SMCY received a recent dividend of $0.1319 on 5/15/2026. This means the current yield ($0.1319 / $6.10 * weeks/months per year paid) is 112.44%.
[37] YieldMax GME Option Income Strategy ETF [GMEY]
GMEY had total dividends of $14.2344 from 9/9/2025 to 5/15/2026. It has been active for 8.2 months. During that time frame it had a starting price of $50.43, a high price of $56.15, a low price of $29.36, and a 5/15/2026 price of $29.36. This means that it had a yield of 28.23%, or an average monthly yield of 3.44%. The peak-to-valley is -47.71%. The capital gains were -41.78%. The overall gain/loss (cap gains + yield) is -13.55%, or a gain/loss per month of -1.65%. The average volume since inception was 10,174.
GMEY received a recent dividend of $0.3280 on 5/15/2026. This means the current yield ($0.3280 / $29.36 * weeks/months per year paid) is 58.09%.
[38] YieldMax Ultra Short Option Income Strategy ETF [SLTY]
SLTY had total dividends of $16.9937 from 8/21/2025 to 5/15/2026. It has been active for 8.79 months. During that time frame it had a starting price of $49.96, a high price of $50.47, a low price of $25.26, and a 5/15/2026 price of $25.66. This means that it had a yield of 34.01%, or an average monthly yield of 3.87%. The peak-to-valley is -49.95%. The capital gains were -48.64%. The overall gain/loss (cap gains + yield) is -14.62%, or a gain/loss per month of -1.66%. The average volume since inception was 41,204.
SLTY received a recent dividend of $0.2961 on 5/14/2026. This means the current yield ($0.2961 / $25.66 * weeks/months per year paid) is 60.00%.
[39] YieldMax MARA Option Income Strategy ETF [MARO]
MARO had total dividends of $23.3953 from 12/10/2024 to 5/15/2026. It has been active for 17.16 months. During that time frame it had a starting price of $47.14, a high price of $53.06, a low price of $5.04, and a 5/15/2026 price of $6.33. This means that it had a yield of 49.63%, or an average monthly yield of 2.89%. The peak-to-valley is -90.50%. The capital gains were -86.57%. The overall gain/loss (cap gains + yield) is -36.94%, or a gain/loss per month of -2.15%. The average volume since inception was 205,972.
MARO received a recent dividend of $0.1319 on 5/15/2026. This means the current yield ($0.1319 / $6.33 * weeks/months per year paid) is 108.35%.
[40] YieldMax MSTR Performance & Distribution Tg 25 ETF [MSST]
MSST had total dividends of $4.5541 from 11/18/2025 to 5/15/2026. It has been active for 5.89 months. During that time frame it had a starting price of $53.14, a high price of $54.29, a low price of $28.30, and a 5/15/2026 price of $41.67. This means that it had a yield of 8.57%, or an average monthly yield of 1.46%. The peak-to-valley is -47.87%. The capital gains were -21.58%. The overall gain/loss (cap gains + yield) is -13.01%, or a gain/loss per month of -2.21%. The average volume since inception was 2,669.
MSST received a recent dividend of $0.2049 on 5/13/2026. This means the current yield ($0.2049 / $41.67 * weeks/months per year paid) is 25.57%.
[41] YieldMax CRCL Option Income Strategy ETF [CRCO]
CRCO had total dividends of $16.3717 from 9/30/2025 to 5/15/2026. It has been active for 7.49 months. During that time frame it had a starting price of $49.21, a high price of $57.31, a low price of $15.01, and a 5/15/2026 price of $23.96. This means that it had a yield of 33.27%, or an average monthly yield of 4.44%. The peak-to-valley is -73.81%. The capital gains were -51.31%. The overall gain/loss (cap gains + yield) is -18.04%, or a gain/loss per month of -2.41%. The average volume since inception was 66,919.
CRCO received a recent dividend of $0.5299 on 5/15/2026. This means the current yield ($0.5299 / $23.96 * weeks/months per year paid) is 115.00%.
[42] YieldMax RDDT Option Income Strategy ETF [RDYY]
RDYY had total dividends of $16.8570 from 9/9/2025 to 5/15/2026. It has been active for 8.2 months. During that time frame it had a starting price of $51.29, a high price of $56.57, a low price of $17.99, and a 5/15/2026 price of $20.55. This means that it had a yield of 32.87%, or an average monthly yield of 4.01%. The peak-to-valley is -68.20%. The capital gains were -59.93%. The overall gain/loss (cap gains + yield) is -27.07%, or a gain/loss per month of -3.30%. The average volume since inception was 34,984.
RDYY received a recent dividend of $0.4076 on 5/15/2026. This means the current yield ($0.4076 / $20.55 * weeks/months per year paid) is 103.14%.
[43] YieldMax Strat Metals & Mining Portfolio Opt Inc [MINY]
MINY had total dividends of $2.7560 from 2/27/2026 to 5/15/2026. It has been active for 2.59 months. During that time frame it had a starting price of $50.29, a high price of $51.40, a low price of $38.67, and a 5/15/2026 price of $43.21. This means that it had a yield of 5.48%, or an average monthly yield of 2.11%. The peak-to-valley is -24.77%. The capital gains were -14.08%. The overall gain/loss (cap gains + yield) is -8.60%, or a gain/loss per month of -3.32%. The average volume since inception was 6,954.
MINY received a recent dividend of $0.2729 on 5/14/2026. This means the current yield ($0.2729 / $43.21 * weeks/months per year paid) is 32.84%.
[44] YieldMax DKNG Option Income Strategy ETF [DRAY]
DRAY had total dividends of $14.4989 from 7/15/2025 to 5/15/2026. It has been active for 10 months. During that time frame it had a starting price of $50.09, a high price of $53.95, a low price of $15.00, and a 5/15/2026 price of $17.61. This means that it had a yield of 28.95%, or an average monthly yield of 2.89%. The peak-to-valley is -72.20%. The capital gains were -64.84%. The overall gain/loss (cap gains + yield) is -35.90%, or a gain/loss per month of -3.59%. The average volume since inception was 15,464.
DRAY received a recent dividend of $0.2724 on 5/15/2026. This means the current yield ($0.2724 / $17.61 * weeks/months per year paid) is 80.44%.
[45] YieldMax RBLX Option Income Strategy ETF [RBLY]
RBLY had total dividends of $15.3441 from 7/29/2025 to 5/15/2026. It has been active for 9.53 months. During that time frame it had a starting price of $49.34, a high price of $58.42, a low price of $12.50, and a 5/15/2026 price of $13.07. This means that it had a yield of 31.10%, or an average monthly yield of 3.26%. The peak-to-valley is -78.60%. The capital gains were -73.51%. The overall gain/loss (cap gains + yield) is -42.41%, or a gain/loss per month of -4.45%. The average volume since inception was 18,276.
RBLY received a recent dividend of $0.1612 on 5/15/2026. This means the current yield ($0.1612 / $13.07 * weeks/months per year paid) is 64.13%.
[46] YieldMax HIMS Option Income Strategy ETF [HIYY]
HIYY had total dividends of $12.5586 from 9/23/2025 to 5/15/2026. It has been active for 7.72 months. During that time frame it had a starting price of $48.32, a high price of $53.97, a low price of $9.53, and a 5/15/2026 price of $14.47. This means that it had a yield of 25.99%, or an average monthly yield of 3.37%. The peak-to-valley is -82.34%. The capital gains were -70.05%. The overall gain/loss (cap gains + yield) is -44.06%, or a gain/loss per month of -5.71%. The average volume since inception was 48,672.
HIYY received a recent dividend of $0.3006 on 5/15/2026. This means the current yield ($0.3006 / $14.47 * weeks/months per year paid) is 108.02%.