
YIELDMAX -- Yield + Capital Gain Analysis 12/5/2025
A more realistic view of current yield trends

As always, please read our disclaimer. Important!
YieldMax’s Reverse Splits
Well, this week YieldMax did a massive reverse split across 15 of its products:
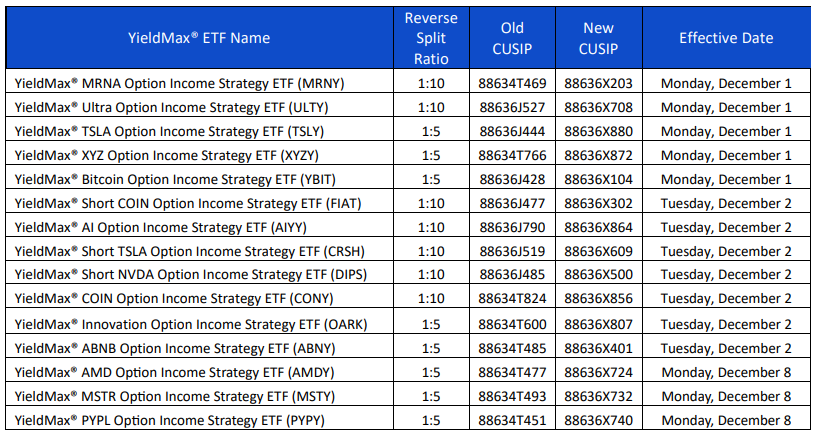
So that is… not good. A reverse split basically means that the NAVS of these funds had become low enough they are starting to run into exchange listing requirements and tradability issues.
Reverse splits of this kind (due to sustained capital losses) are never great for the firm that has to do them.
Additionally, YieldMax has not yet reverse-adjusted their dividend reporting, and as a result for the 15 products above, YieldMax is currently showing
the new adjusted share price (5x or 10x) (correct)
the latest dividend at 10x or 5x (correct)
previous dividends at 1x (incorrect)
So we have applied the following formula:
((total dividends - most recent dividend) * reverse split multiplier) + most recent dividend
That should give a fairly good “guesstimate” as to what those previous total dividends should be until they are properly reported.
In the interim, we will italicize those entries in the “Individual Stock Analysis” section below. So please do take those entries in italics with a grain of salt until YieldMax gets their reporting under control.
Here is the list of ETFs which are affected: ABNY, AIYY, AMDY, CONY, CRSH, DIPS, FIAT, MRNY, MSTY, OARK, PYPY, TSLY, ULTY, XYZY, YBIT.
For point of reference, here are the reverse split factors in alphabetical order:
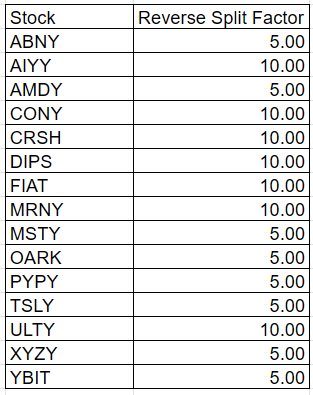
AMDY, MSTY, and PYPY won’t be affected until 12/8/2025 and as a result will be unitalicized below.
The Current Yield Conundrum
It is kind of interesting that we did a post recently on NAV erosion which speaks directly to this issue in the “covered call ETF” space:

The basic underlying argument is — that if you are going to have massive distributions, the money has to come from somewhere.
With covered-call ETFs, the understanding is that option premium income is going to pay for the majority of those distributions.
In reality, a lot of firms also engage in “return of capital” meaning that they distribute option premium (income) and interest, but also just give some of your money back to pump up the distribution numbers.
In practice, “return of capital” is a bit like a reverse mortgage.
In a reverse mortgage, you take a mortgage out on your fully-paid off house, and the bank pays you money each month until the bank actually owns the house.
A reverse mortgage gives you steady income while at the same time the asset (your house) basically erodes away underneath you until there is nothing left.
Same principle here.
In a reverse mortgage, most folks understand what they are getting into — and that eventually their house will be owned entirely by the bank.
With some covered-call ETFs, however, I’m not sure that all investors actually understand what is going on.
Investors see the huge distribution number, do the math, and think that at the end of the year they will end up with a) their original investment (or better) plus b) whatever the current yield is — and current yields sometimes top 75%.
Except a lot of an ETF’s distribution might be “return of capital.”
A fact which might be stated in all of the fund’s literature… but “return of capital” might not be that well understood by the average investor.
The result is sometimes NAV erosion which is equal to, or greater than, the distributions — which means you make an investment, get huge distributions, but still lose money.
Anyways, that’s all covered in this post…
…so we don’t really need to belabor the point any further other than to say — “current yield isn’t exactly what you think it would be.”
YieldMax General Info
Given the popularity of YieldMax we thought we would continue our analysis of all of their products from the standpoint of “yield + capital gain.”
As mentioned last week, YieldMax has transitioned almost all of their products to a weekly-pay model — meaning you get paid a distribution once a week for all YieldMax products except BIGY, RNTY, and SOXY (those are still monthly-payers for the moment).
We will be keeping YieldMax separate from the other weekly payers, because 100+ stocks is just way too many to cover in one post.
Though we did do that last month if you want to see how all weekly payers stack up together.

Arguably, 60 products is also too much here — but that’s what we do best — all of it!
We won’t do our usual “yield + capital gain” discussion this week. As mentioned above, we did all of that in a longer post which covers that same material…
…so just consider the content of that post quoted here in its entirety.
New Products
YieldMax adds three new products this week: MSST (#60), NVIT (#12), and TEST (#1).
Analysis Tables
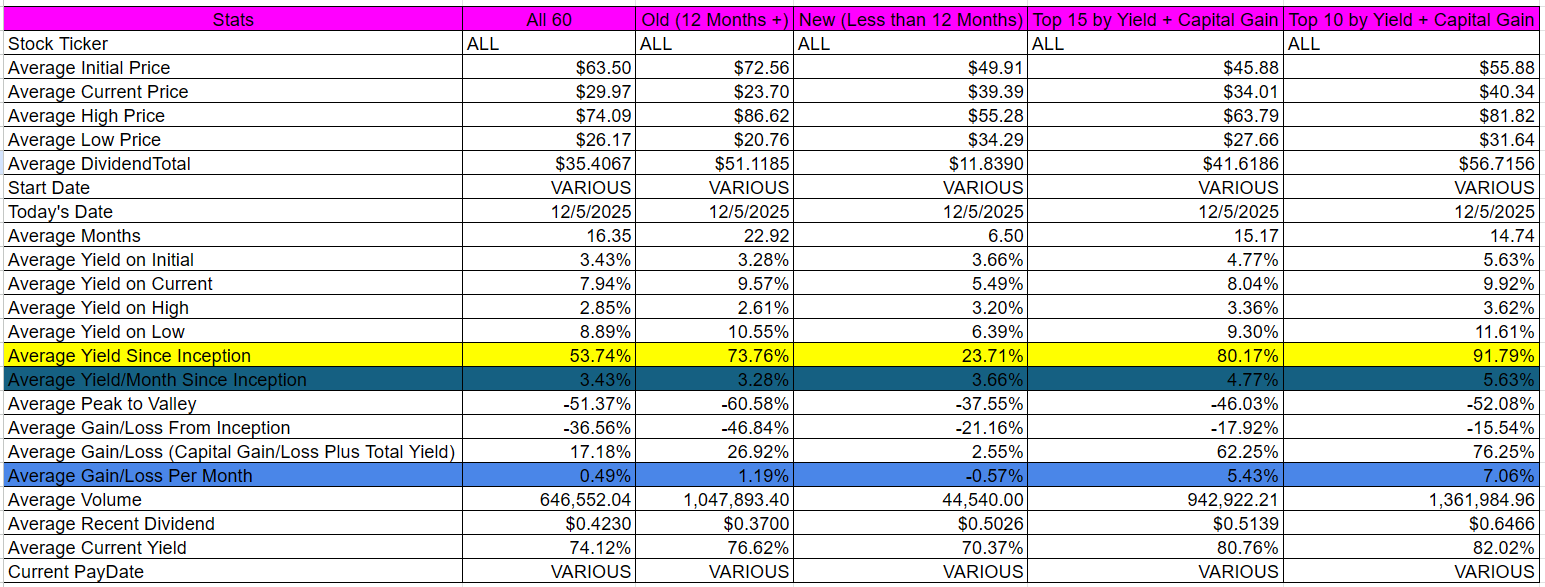
Here is a summary of all YieldMax products which you might find useful, including Top 10 and Top 15 by “yield + capital gain” sections (the right two columns).
And then here are the top 15 by “yield + capital gain” — but normalized by months in existence.
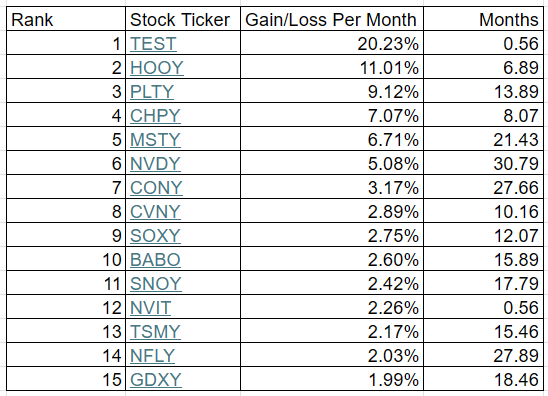
Please note these performance figures are “yield + capital gain” normalized by month (total yield + total capital gain / months in existence). This is NOT current yield.
Also note that these are “since inception” numbers which reflect the ENTIRE historical record of an ETF — not necessarily current trends.
You will notice that some of the most popular YieldMax products — like ULTY — don’t even make it into this Top 15 “yield + capital gain” list.
For all of the entries below, do make sure to look at the full picture (the first paragraph of each entry) before riding the rapids of “The River of Current Yield.”
Current yield is still listed (second paragraph of each entry), but that is out of order.
Here everything is sorted by descending “yield + capital gain” (in bold in each first paragraph of each entry). A far more useful metric.
Occasionally we may hold positions in some of these stocks.
All dividends are calculated based on the “Ex-EFF Date.”
This is a free post! To see what else we’re up to, and to support our work, please consider a paid subscription. Only $5/month or $60/year!
Individual Stock Analysis (60 Entries)
As previously noted, entries in italics below are based on incomplete reporting from YieldMax — they are “best guestimates” based on the reverse split factor.
[1] YieldMax TSLA Performance Distribution Target 25 ETF [TEST]
TEST had total dividends of $0.2543 from 11/18/2025 to 12/5/2025. It has been active for 0.56 months. During that time frame it had a starting price of $49.66, a high price of $55.18, a low price of $47.99, and a 12/5/2025 price of $55.02. This means that it had a yield of 0.51%, or an average monthly yield of 0.92%. The peak-to-valley is -13.03%.* The capital gains were 10.79%. The overall gain/loss (cap gains + yield) is 11.31%, or a gain/loss per month of 20.23%. The average volume since inception was 2,072.
TEST received a recent dividend of $0.2543 on 12/3/2025. This means the current yield ($0.2543 / $55.02 * weeks/months per year paid) is 24.03%.
*For an explanation of how Dividend Farmer calculates “peak-to-valley,” please see the FAQ.
[2] YieldMax HOOD Option Income Strategy ETF [HOOY]
HOOY had total dividends of $37.4732 from 5/8/2025 to 12/5/2025. It has been active for 6.89 months. During that time frame it had a starting price of $52.82, a high price of $80.99, a low price of $47.06, and a 12/5/2025 price of $55.40. This means that it had a yield of 70.95%, or an average monthly yield of 10.30%. The peak-to-valley is -41.89%. The capital gains were 4.88%. The overall gain/loss (cap gains + yield) is 75.83%, or a gain/loss per month of 11.01%. The average volume since inception was 203,947.
HOOY received a recent dividend of $1.3217 on 12/5/2025. This means the current yield ($1.3217 / $55.40 * weeks/months per year paid) is 124.06%.
[3] YieldMax PLTR Option Income Strategy ETF [PLTY]
PLTY had total dividends of $61.5212 from 10/8/2024 to 12/5/2025. It has been active for 13.89 months. During that time frame it had a starting price of $51.43, a high price of $95.08, a low price of $46.28, and a 12/5/2025 price of $55.05. This means that it had a yield of 119.62%, or an average monthly yield of 8.61%. The peak-to-valley is -51.33%. The capital gains were 7.04%. The overall gain/loss (cap gains + yield) is 126.66%, or a gain/loss per month of 9.12%. The average volume since inception was 326,263.
PLTY received a recent dividend of $1.3015 on 12/5/2025. This means the current yield ($1.3015 / $55.05 * weeks/months per year paid) is 122.94%.
[4] YieldMax Semiconductor Portfolio Option Income ETF [CHPY]
CHPY had total dividends of $14.0213 from 4/3/2025 to 12/5/2025. It has been active for 8.07 months. During that time frame it had a starting price of $45.65, a high price of $60.21, a low price of $40.40, and a 12/5/2025 price of $57.67. This means that it had a yield of 30.71%, or an average monthly yield of 3.81%. The peak-to-valley is -32.90%. The capital gains were 26.33%. The overall gain/loss (cap gains + yield) is 57.05%, or a gain/loss per month of 7.07%. The average volume since inception was 47,191.
CHPY received a recent dividend of $0.4347 on 12/4/2025. This means the current yield ($0.4347 / $57.67 * weeks/months per year paid) is 39.20%.
[5] YieldMax MSTR Option Income Strategy ETF [MSTY]
MSTY had total dividends of $44.6550 from 2/22/2024 to 12/5/2025. It has been active for 21.43 months. During that time frame it had a starting price of $21.19, a high price of $46.50, a low price of $6.22, and a 12/5/2025 price of $7.01. This means that it had a yield of 210.74%, or an average monthly yield of 9.83%. The peak-to-valley is -86.62%. The capital gains were -66.92%. The overall gain/loss (cap gains + yield) is 143.82%, or a gain/loss per month of 6.71%. The average volume since inception was 5,341,879.
MSTY received a recent dividend of $0.1388 on 12/5/2025. This means the current yield ($0.1388 / $7.01 * weeks/months per year paid) is 102.96%.
[6] YieldMax NVDA Option Income Strategy ETF [NVDY]
NVDY had total dividends of $36.3382 from 5/11/2023 to 12/5/2025. It has been active for 30.79 months. During that time frame it had a starting price of $19.91, a high price of $31.77, a low price of $12.47, and a 12/5/2025 price of $14.69. This means that it had a yield of 182.51%, or an average monthly yield of 5.93%. The peak-to-valley is -60.75%. The capital gains were -26.22%. The overall gain/loss (cap gains + yield) is 156.29%, or a gain/loss per month of 5.08%. The average volume since inception was 2,033,806.
NVDY received a recent dividend of $0.1649 on 12/5/2025. This means the current yield ($0.1649 / $14.69 * weeks/months per year paid) is 58.37%.
[7] YieldMax COIN Option Income Strategy ETF [CONY]
CONY had total dividends of $324.6421 from 8/15/2023 to 12/5/2025. It has been active for 27.66 months. During that time frame it had a starting price of $197.65, a high price of $301.80, a low price of $42.50, and a 12/5/2025 price of $46.53. This means that it had a yield of 164.25%, or an average monthly yield of 5.94%. The peak-to-valley is -85.92%. The capital gains were -76.46%. The overall gain/loss (cap gains + yield) is 87.79%, or a gain/loss per month of 3.17%. The average volume since inception was 5,519,648.
CONY received a recent dividend of $1.1311 on 12/5/2025. This means the current yield ($1.1311 / $46.53 * weeks/months per year paid) is 126.41%.
[8] YieldMax CVNA Option Income Strategy ETF [CVNY]
CVNY had total dividends of $27.4920 from 1/30/2025 to 12/5/2025. It has been active for 10.16 months. During that time frame it had a starting price of $50.00, a high price of $58.17, a low price of $24.83, and a 12/5/2025 price of $37.18. This means that it had a yield of 54.98%, or an average monthly yield of 5.41%. The peak-to-valley is -57.31%. The capital gains were -25.64%. The overall gain/loss (cap gains + yield) is 29.34%, or a gain/loss per month of 2.89%. The average volume since inception was 65,087.
CVNY received a recent dividend of $0.8857 on 12/5/2025. This means the current yield ($0.8857 / $37.18 * weeks/months per year paid) is 123.87%.
[9] YieldMax Target 12 Semiconductor Option Inc ETF [SOXY]
SOXY had total dividends of $6.2152 from 12/3/2024 to 12/5/2025. It has been active for 12.07 months. During that time frame it had a starting price of $50.10, a high price of $62.95, a low price of $35.02, and a 12/5/2025 price of $60.52. This means that it had a yield of 12.41%, or an average monthly yield of 1.03%. The peak-to-valley is -44.37%. The capital gains were 20.80%. The overall gain/loss (cap gains + yield) is 33.20%, or a gain/loss per month of 2.75%. The average volume since inception was 4,107.
SOXY received a recent dividend of $0.5953 on 12/4/2025. This means the current yield ($0.5953 / $60.52 * weeks/months per year paid) is 11.80%.
[10] YieldMax BABA Option Income Strategy ETF [BABO]
BABO had total dividends of $14.5431 from 8/8/2024 to 12/5/2025. It has been active for 15.89 months. During that time frame it had a starting price of $20.42, a high price of $25.53, a low price of $13.62, and a 12/5/2025 price of $14.30. This means that it had a yield of 71.22%, or an average monthly yield of 4.48%. The peak-to-valley is -46.65%. The capital gains were -29.97%. The overall gain/loss (cap gains + yield) is 41.25%, or a gain/loss per month of 2.60%. The average volume since inception was 75,850.
BABO received a recent dividend of $0.2381 on 12/5/2025. This means the current yield ($0.2381 / $14.30 * weeks/months per year paid) is 86.58%.
[11] YieldMax SNOW Option Income Strategy ETF [SNOY]
SNOY had total dividends of $15.9749 from 6/11/2024 to 12/5/2025. It has been active for 17.79 months. During that time frame it had a starting price of $20.18, a high price of $23.76, a low price of $12.74, and a 12/5/2025 price of $12.90. This means that it had a yield of 79.16%, or an average monthly yield of 4.45%. The peak-to-valley is -46.38%. The capital gains were -36.08%. The overall gain/loss (cap gains + yield) is 43.09%, or a gain/loss per month of 2.42%. The average volume since inception was 114,847.
SNOY received a recent dividend of $0.2700 on 12/5/2025. This means the current yield ($0.2700 / $12.90 * weeks/months per year paid) is 108.84%.
[12] YieldMax NVDA Performance Distribution Target 25 ETF [NVIT]
NVIT had total dividends of $0.2332 from 11/18/2025 to 12/5/2025. It has been active for 0.56 months. During that time frame it had a starting price of $49.25, a high price of $52.27, a low price of $46.92, and a 12/5/2025 price of $49.64. This means that it had a yield of 0.47%, or an average monthly yield of 0.85%. The peak-to-valley is -10.24%. The capital gains were 0.79%. The overall gain/loss (cap gains + yield) is 1.27%, or a gain/loss per month of 2.26%. The average volume since inception was 4,844.
NVIT received a recent dividend of $0.2332 on 12/3/2025. This means the current yield ($0.2332 / $49.64 * weeks/months per year paid) is 24.43%.
[13] YieldMax TSM Option Income Strategy ETF [TSMY]
TSMY had total dividends of $11.1539 from 8/21/2024 to 12/5/2025. It has been active for 15.46 months. During that time frame it had a starting price of $20.03, a high price of $22.31, a low price of $12.10, and a 12/5/2025 price of $15.60. This means that it had a yield of 55.69%, or an average monthly yield of 3.60%. The peak-to-valley is -45.76%. The capital gains were -22.12%. The overall gain/loss (cap gains + yield) is 33.57%, or a gain/loss per month of 2.17%. The average volume since inception was 79,358.
TSMY received a recent dividend of $0.2493 on 12/5/2025. This means the current yield ($0.2493 / $15.60 * weeks/months per year paid) is 83.10%.
[14] YieldMax NFLX Option Income Strategy ETF [NFLY]
NFLY had total dividends of $18.4450 from 8/8/2023 to 12/5/2025. It has been active for 27.89 months. During that time frame it had a starting price of $19.99, a high price of $20.36, a low price of $12.56, and a 12/5/2025 price of $12.85. This means that it had a yield of 92.27%, or an average monthly yield of 3.31%. The peak-to-valley is -38.31%. The capital gains were -35.72%. The overall gain/loss (cap gains + yield) is 56.55%, or a gain/loss per month of 2.03%. The average volume since inception was 119,217.
NFLY received a recent dividend of $0.1793 on 12/5/2025. This means the current yield ($0.1793 / $12.85 * weeks/months per year paid) is 72.56%.
[15] YieldMax Gold Miners Option Income Strategy ETF [GDXY]
GDXY had total dividends of $11.3165 from 5/21/2024 to 12/5/2025. It has been active for 18.46 months. During that time frame it had a starting price of $19.85, a high price of $19.98, a low price of $14.18, and a 12/5/2025 price of $15.82. This means that it had a yield of 57.01%, or an average monthly yield of 3.09%. The peak-to-valley is -29.03%. The capital gains were -20.30%. The overall gain/loss (cap gains + yield) is 36.71%, or a gain/loss per month of 1.99%. The average volume since inception was 205,718.
GDXY received a recent dividend of $0.3109 on 12/5/2025. This means the current yield ($0.3109 / $15.82 * weeks/months per year paid) is 102.19%.
[16] YieldMax AMZN Option Income Strategy ETF [AMZY]
AMZY had total dividends of $17.8715 from 7/25/2023 to 12/5/2025. It has been active for 28.33 months. During that time frame it had a starting price of $20.05, a high price of $24.10, a low price of $12.90, and a 12/5/2025 price of $13.38. This means that it had a yield of 89.13%, or an average monthly yield of 3.15%. The peak-to-valley is -46.47%. The capital gains were -33.27%. The overall gain/loss (cap gains + yield) is 55.87%, or a gain/loss per month of 1.97%. The average volume since inception was 248,291.
AMZY received a recent dividend of $0.1945 on 12/5/2025. This means the current yield ($0.1945 / $13.38 * weeks/months per year paid) is 75.59%.
[17] YieldMax Magnificent 7 Fund of Option Income ETFs [YMAG]
YMAG had total dividends of $13.7654 from 1/30/2024 to 12/5/2025. It has been active for 22.16 months. During that time frame it had a starting price of $19.89, a high price of $21.91, a low price of $12.85, and a 12/5/2025 price of $14.71. This means that it had a yield of 69.21%, or an average monthly yield of 3.12%. The peak-to-valley is -41.35%. The capital gains were -26.04%. The overall gain/loss (cap gains + yield) is 43.16%, or a gain/loss per month of 1.95%. The average volume since inception was 550,005.
YMAG received a recent dividend of $0.0974 on 12/4/2025. This means the current yield ($0.0974 / $14.71 * weeks/months per year paid) is 34.43%.
[18] YieldMax META Option Income Strategy ETF [FBY]
FBY had total dividends of $18.8086 from 7/28/2023 to 12/5/2025. It has been active for 28.23 months. During that time frame it had a starting price of $20.63, a high price of $24.49, a low price of $12.10, and a 12/5/2025 price of $13.03. This means that it had a yield of 91.17%, or an average monthly yield of 3.23%. The peak-to-valley is -50.59%. The capital gains were -36.84%. The overall gain/loss (cap gains + yield) is 54.33%, or a gain/loss per month of 1.92%. The average volume since inception was 140,925.
FBY received a recent dividend of $0.2504 on 12/5/2025. This means the current yield ($0.2504 / $13.03 * weeks/months per year paid) is 99.93%.
[19] YieldMax MSTR Short Option Income Strategy ETF [WNTR]
WNTR had total dividends of $21.4432 from 3/27/2025 to 12/5/2025. It has been active for 8.26 months. During that time frame it had a starting price of $50.06, a high price of $60.64, a low price of $27.24, and a 12/5/2025 price of $36.39. This means that it had a yield of 42.83%, or an average monthly yield of 5.18%. The peak-to-valley is -55.08%. The capital gains were -27.31%. The overall gain/loss (cap gains + yield) is 15.53%, or a gain/loss per month of 1.88%. The average volume since inception was 99,988.
WNTR received a recent dividend of $0.6443 on 12/5/2025. This means the current yield ($0.6443 / $36.39 * weeks/months per year paid) is 92.07%.
[20] YieldMax AI & Tech Portfolio Option Income ETF [GPTY]
GPTY had total dividends of $13.4030 from 1/23/2025 to 12/5/2025. It has been active for 10.39 months. During that time frame it had a starting price of $50.09, a high price of $50.43, a low price of $32.92, and a 12/5/2025 price of $44.91. This means that it had a yield of 26.76%, or an average monthly yield of 2.57%. The peak-to-valley is -34.72%. The capital gains were -10.34%. The overall gain/loss (cap gains + yield) is 16.42%, or a gain/loss per month of 1.58%. The average volume since inception was 37,211.
GPTY received a recent dividend of $0.2997 on 12/4/2025. This means the current yield ($0.2997 / $44.91 * weeks/months per year paid) is 34.70%.
[21] YieldMax MSFT Option Income Strategy ETF [MSFO]
MSFO had total dividends of $12.8626 from 8/25/2023 to 12/5/2025. It has been active for 27.33 months. During that time frame it had a starting price of $20.18, a high price of $23.48, a low price of $14.30, and a 12/5/2025 price of $15.59. This means that it had a yield of 63.74%, or an average monthly yield of 2.33%. The peak-to-valley is -39.10%. The capital gains were -22.75%. The overall gain/loss (cap gains + yield) is 40.99%, or a gain/loss per month of 1.50%. The average volume since inception was 61,850.
MSFO received a recent dividend of $0.1731 on 12/5/2025. This means the current yield ($0.1731 / $15.59 * weeks/months per year paid) is 57.74%.
[22] YieldMax Target 12 Big 50 Option Income ETF [BIGY]
BIGY had total dividends of $6.0279 from 11/21/2024 to 12/5/2025. It has been active for 12.46 months. During that time frame it had a starting price of $50.15, a high price of $54.64, a low price of $40.00, and a 12/5/2025 price of $53.05. This means that it had a yield of 12.02%, or an average monthly yield of 0.96%. The peak-to-valley is -26.79%. The capital gains were 5.78%. The overall gain/loss (cap gains + yield) is 17.80%, or a gain/loss per month of 1.43%. The average volume since inception was 5,288.
BIGY received a recent dividend of $0.5331 on 12/4/2025. This means the current yield ($0.5331 / $53.05 * weeks/months per year paid) is 12.06%.
[23] YieldMax GOOGL Option Income Strategy ETF [GOOY]
GOOY had total dividends of $12.6634 from 7/28/2023 to 12/5/2025. It has been active for 28.23 months. During that time frame it had a starting price of $20.50, a high price of $20.83, a low price of $10.89, and a 12/5/2025 price of $15.26. This means that it had a yield of 61.77%, or an average monthly yield of 2.19%. The peak-to-valley is -47.72%. The capital gains were -25.56%. The overall gain/loss (cap gains + yield) is 36.21%, or a gain/loss per month of 1.28%. The average volume since inception was 129,609.
GOOY received a recent dividend of $0.2508 on 12/5/2025. This means the current yield ($0.2508 / $15.26 * weeks/months per year paid) is 85.46%.
[24] YieldMax Universe Fund of Option Income ETFs [YMAX]
YMAX had total dividends of $14.9076 from 1/17/2024 to 12/5/2025. It has been active for 22.59 months. During that time frame it had a starting price of $19.90, a high price of $21.94, a low price of $10.01, and a 12/5/2025 price of $10.70. This means that it had a yield of 74.91%, or an average monthly yield of 3.32%. The peak-to-valley is -54.38%. The capital gains were -46.23%. The overall gain/loss (cap gains + yield) is 28.68%, or a gain/loss per month of 1.27%. The average volume since inception was 1,328,036.
YMAX received a recent dividend of $0.0964 on 12/4/2025. This means the current yield ($0.0964 / $10.70 * weeks/months per year paid) is 46.85%.
[25] YieldMax XYZ Option Income Strategy ETF [XYZY]
XYZY had total dividends of $100.9547 from 10/11/2023 to 12/5/2025. It has been active for 25.79 months. During that time frame it had a starting price of $100.96, a high price of $133.49, a low price of $32.65, and a 12/5/2025 price of $32.80. This means that it had a yield of 99.99%, or an average monthly yield of 3.88%. The peak-to-valley is -75.54%. The capital gains were -67.51%. The overall gain/loss (cap gains + yield) is 32.48%, or a gain/loss per month of 1.26%. The average volume since inception was 90,364.
XYZY received a recent dividend of $0.6807 on 12/5/2025. This means the current yield ($0.6807 / $32.80 * weeks/months per year paid) is 107.92%.
[26] YieldMax JPM Option Income Strategy ETF [JPMO]
JPMO had total dividends of $10.7771 from 9/12/2023 to 12/5/2025. It has been active for 26.76 months. During that time frame it had a starting price of $20.06, a high price of $22.30, a low price of $13.64, and a 12/5/2025 price of $15.97. This means that it had a yield of 53.72%, or an average monthly yield of 2.01%. The peak-to-valley is -38.83%. The capital gains were -20.39%. The overall gain/loss (cap gains + yield) is 33.34%, or a gain/loss per month of 1.25%. The average volume since inception was 27,965.
JPMO received a recent dividend of $0.1903 on 12/5/2025. This means the current yield ($0.1903 / $15.97 * weeks/months per year paid) is 61.96%.
[27] YieldMax AMD Option Income Strategy ETF [AMDY]
AMDY had total dividends of $18.5906 from 9/19/2023 to 12/5/2025. It has been active for 26.53 months. During that time frame it had a starting price of $20.00, a high price of $24.28, a low price of $5.83, and a 12/5/2025 price of $7.84. This means that it had a yield of 92.95%, or an average monthly yield of 3.50%. The peak-to-valley is -75.99%. The capital gains were -60.80%. The overall gain/loss (cap gains + yield) is 32.15%, or a gain/loss per month of 1.21%. The average volume since inception was 554,804.
AMDY received a recent dividend of $0.1544 on 12/5/2025. This means the current yield ($0.1544 / $7.84 * weeks/months per year paid) is 102.41%.
[28] YieldMax Russell 2000 0DTE Covered Call Strat ETF [RDTY]
RDTY had total dividends of $13.1503 from 3/6/2025 to 12/5/2025. It has been active for 8.95 months. During that time frame it had a starting price of $49.21, a high price of $50.07, a low price of $39.24, and a 12/5/2025 price of $40.51. This means that it had a yield of 26.72%, or an average monthly yield of 2.98%. The peak-to-valley is -21.63%. The capital gains were -17.68%. The overall gain/loss (cap gains + yield) is 9.04%, or a gain/loss per month of 1.01%. The average volume since inception was 7,300.
RDTY received a recent dividend of $0.3234 on 12/4/2025. This means the current yield ($0.3234 / $40.51 * weeks/months per year paid) is 41.51%.
[29] YieldMax Nasdaq 100 0DTE Covered Call Strategy ETF [QDTY]
QDTY had total dividends of $10.4513 from 2/13/2025 to 12/5/2025. It has been active for 9.72 months. During that time frame it had a starting price of $50.61, a high price of $52.55, a low price of $36.76, and a 12/5/2025 price of $44.52. This means that it had a yield of 20.65%, or an average monthly yield of 2.12%. The peak-to-valley is -30.05%. The capital gains were -12.03%. The overall gain/loss (cap gains + yield) is 8.62%, or a gain/loss per month of 0.89%. The average volume since inception was 10,288.
QDTY received a recent dividend of $0.2795 on 12/4/2025. This means the current yield ($0.2795 / $44.52 * weeks/months per year paid) is 32.65%.
[30] YieldMax AAPL Option Income Strategy ETF [APLY]
APLY had total dividends of $11.8355 from 4/18/2023 to 12/5/2025. It has been active for 31.56 months. During that time frame it had a starting price of $20.20, a high price of $23.02, a low price of $11.72, and a 12/5/2025 price of $13.73. This means that it had a yield of 58.59%, or an average monthly yield of 1.86%. The peak-to-valley is -49.09%. The capital gains were -32.03%. The overall gain/loss (cap gains + yield) is 26.56%, or a gain/loss per month of 0.84%. The average volume since inception was 87,387.
APLY received a recent dividend of $0.1182 on 12/5/2025. This means the current yield ($0.1182 / $13.73 * weeks/months per year paid) is 44.77%.
[31] YieldMax S&P 500 0DTE Covered Call Strategy ETF [SDTY]
SDTY had total dividends of $8.9311 from 2/6/2025 to 12/5/2025. It has been active for 9.95 months. During that time frame it had a starting price of $50.29, a high price of $51.29, a low price of $38.59, and a 12/5/2025 price of $45.28. This means that it had a yield of 17.76%, or an average monthly yield of 1.78%. The peak-to-valley is -24.76%. The capital gains were -9.96%. The overall gain/loss (cap gains + yield) is 7.80%, or a gain/loss per month of 0.78%. The average volume since inception was 10,913.
SDTY received a recent dividend of $0.2032 on 12/4/2025. This means the current yield ($0.2032 / $45.28 * weeks/months per year paid) is 23.34%.
[32] YieldMax PYPL Option Income Strategy ETF [PYPY]
PYPY had total dividends of $14.9803 from 9/26/2023 to 12/5/2025. It has been active for 26.3 months. During that time frame it had a starting price of $20.02, a high price of $21.15, a low price of $8.42, and a 12/5/2025 price of $8.68. This means that it had a yield of 74.83%, or an average monthly yield of 2.85%. The peak-to-valley is -60.19%. The capital gains were -56.64%. The overall gain/loss (cap gains + yield) is 18.18%, or a gain/loss per month of 0.69%. The average volume since inception was 45,920.
PYPY received a recent dividend of $0.1256 on 12/5/2025. This means the current yield ($0.1256 / $8.68 * weeks/months per year paid) is 75.24%.
[33] YieldMax DIS Option Income Strategy ETF [DISO]
DISO had total dividends of $12.1569 from 8/25/2023 to 12/5/2025. It has been active for 27.33 months. During that time frame it had a starting price of $20.16, a high price of $22.69, a low price of $11.45, and a 12/5/2025 price of $11.61. This means that it had a yield of 60.30%, or an average monthly yield of 2.21%. The peak-to-valley is -49.54%. The capital gains were -42.41%. The overall gain/loss (cap gains + yield) is 17.89%, or a gain/loss per month of 0.65%. The average volume since inception was 16,036.
DISO received a recent dividend of $0.1418 on 12/5/2025. This means the current yield ($0.1418 / $11.61 * weeks/months per year paid) is 63.51%.
[34] YieldMax Target 12 Real Estate Option Income ETF [RNTY]
RNTY had total dividends of $3.5506 from 4/17/2025 to 12/5/2025. It has been active for 7.59 months. During that time frame it had a starting price of $50.86, a high price of $53.02, a low price of $48.72, and a 12/5/2025 price of $49.13. This means that it had a yield of 6.98%, or an average monthly yield of 0.92%. The peak-to-valley is -8.11%. The capital gains were -3.40%. The overall gain/loss (cap gains + yield) is 3.58%, or a gain/loss per month of 0.47%. The average volume since inception was 1,695.
RNTY received a recent dividend of $0.4951 on 12/4/2025. This means the current yield ($0.4951 / $49.13 * weeks/months per year paid) is 12.09%.
[35] YieldMax Innovation Option Income Strategy ETF [OARK]
OARK had total dividends of $78.6231 from 11/23/2022 to 12/5/2025. It has been active for 36.39 months. During that time frame it had a starting price of $100.10, a high price of $106.32, a low price of $31.70, and a 12/5/2025 price of $38.40. This means that it had a yield of 78.54%, or an average monthly yield of 2.16%. The peak-to-valley is -70.18%. The capital gains were -61.64%. The overall gain/loss (cap gains + yield) is 16.91%, or a gain/loss per month of 0.46%. The average volume since inception was 119,797.
OARK received a recent dividend of $0.6356 on 12/5/2025. This means the current yield ($0.6356 / $38.40 * weeks/months per year paid) is 86.07%.
[36] YieldMax BRK B Option Income Strategy ETF [BRKC]
BRKC had total dividends of $4.4734 from 6/5/2025 to 12/5/2025. It has been active for 6 months. During that time frame it had a starting price of $49.68, a high price of $50.66, a low price of $45.28, and a 12/5/2025 price of $45.75. This means that it had a yield of 9.00%, or an average monthly yield of 1.50%. The peak-to-valley is -10.62%. The capital gains were -7.91%. The overall gain/loss (cap gains + yield) is 1.09%, or a gain/loss per month of 0.18%. The average volume since inception was 13,335.
BRKC received a recent dividend of $0.2639 on 12/5/2025. This means the current yield ($0.2639 / $45.75 * weeks/months per year paid) is 30.00%.
[37] YieldMax XOM Option Income Strategy ETF [XOMO]
XOMO had total dividends of $8.4009 from 8/31/2023 to 12/5/2025. It has been active for 27.13 months. During that time frame it had a starting price of $20.01, a high price of $23.38, a low price of $11.42, and a 12/5/2025 price of $11.58. This means that it had a yield of 41.98%, or an average monthly yield of 1.55%. The peak-to-valley is -51.15%. The capital gains were -42.13%. The overall gain/loss (cap gains + yield) is -0.15%, or a gain/loss per month of -0.01%. The average volume since inception was 40,611.
XOMO received a recent dividend of $0.0474 on 12/5/2025. This means the current yield ($0.0474 / $11.58 * weeks/months per year paid) is 21.28%.
[38] YieldMax Ultra Option Income Strategy ETF [ULTY]
ULTY had total dividends of $151.4751 from 2/29/2024 to 12/5/2025. It has been active for 21.2 months. During that time frame it had a starting price of $193.50, a high price of $205.50, a low price of $38.80, and a 12/5/2025 price of $39.98. This means that it had a yield of 78.28%, or an average monthly yield of 3.69%. The peak-to-valley is -81.12%. The capital gains were -79.34%. The overall gain/loss (cap gains + yield) is -1.06%, or a gain/loss per month of -0.05%. The average volume since inception was 9,804,019.
ULTY received a recent dividend of $0.5881 on 12/4/2025. This means the current yield ($0.5881 / $39.98 * weeks/months per year paid) is 76.49%.
[39] YieldMax Bitcoin Option Income Strategy ETF [YBIT]
YBIT had total dividends of $66.0586 from 4/23/2024 to 12/5/2025. It has been active for 19.39 months. During that time frame it had a starting price of $102.25, a high price of $118.10, a low price of $33.30, and a 12/5/2025 price of $35.08. This means that it had a yield of 64.60%, or an average monthly yield of 3.33%. The peak-to-valley is -71.80%. The capital gains were -65.69%. The overall gain/loss (cap gains + yield) is -1.09%, or a gain/loss per month of -0.06%. The average volume since inception was 273,276.
YBIT received a recent dividend of $0.6936 on 12/5/2025. This means the current yield ($0.6936 / $35.08 * weeks/months per year paid) is 102.81%.
[40] YieldMax Crypto Industry & Tech Port Opt Inc ETF [LFGY]
LFGY had total dividends of $22.5297 from 1/14/2025 to 12/5/2025. It has been active for 10.69 months. During that time frame it had a starting price of $51.25, a high price of $55.11, a low price of $25.63, and a 12/5/2025 price of $28.24. This means that it had a yield of 43.96%, or an average monthly yield of 4.11%. The peak-to-valley is -53.49%. The capital gains were -44.90%. The overall gain/loss (cap gains + yield) is -0.94%, or a gain/loss per month of -0.09%. The average volume since inception was 148,525.
LFGY received a recent dividend of $0.3498 on 12/4/2025. This means the current yield ($0.3498 / $28.24 * weeks/months per year paid) is 64.41%.
[41] YieldMax TSLA Option Income Strategy ETF [TSLY]
TSLY had total dividends of $132.2890 from 11/23/2022 to 12/5/2025. It has been active for 36.39 months. During that time frame it had a starting price of $200.40, a high price of $217.63, a low price of $34.50, and a 12/5/2025 price of $39.22. This means that it had a yield of 66.01%, or an average monthly yield of 1.81%. The peak-to-valley is -84.15%. The capital gains were -80.43%. The overall gain/loss (cap gains + yield) is -14.42%, or a gain/loss per month of -0.40%. The average volume since inception was 7,061,129.
TSLY received a recent dividend of $0.9350 on 12/5/2025. This means the current yield ($0.9350 / $39.22 * weeks/months per year paid) is 123.97%.
[42] YieldMax Dorsey Wright Hybrid 5 Income ETF [FIVY]
FIVY had total dividends of $13.2035 from 12/17/2024 to 12/5/2025. It has been active for 11.59 months. During that time frame it had a starting price of $49.78, a high price of $52.51, a low price of $29.34, and a 12/5/2025 price of $33.04. This means that it had a yield of 26.52%, or an average monthly yield of 2.29%. The peak-to-valley is -44.12%. The capital gains were -33.63%. The overall gain/loss (cap gains + yield) is -7.10%, or a gain/loss per month of -0.61%. The average volume since inception was 10,508.
FIVY received a recent dividend of $0.2211 on 12/4/2025. This means the current yield ($0.2211 / $33.04 * weeks/months per year paid) is 34.80%.
[43] YieldMax Dorsey Wright Featured 5 Income ETF [FEAT]
FEAT had total dividends of $17.7198 from 12/17/2024 to 12/5/2025. It has been active for 11.59 months. During that time frame it had a starting price of $49.71, a high price of $50.21, a low price of $24.88, and a 12/5/2025 price of $27.37. This means that it had a yield of 35.65%, or an average monthly yield of 3.08%. The peak-to-valley is -50.45%. The capital gains were -44.94%. The overall gain/loss (cap gains + yield) is -9.29%, or a gain/loss per month of -0.80%. The average volume since inception was 25,599.
FEAT received a recent dividend of $0.3205 on 12/4/2025. This means the current yield ($0.3205 / $27.37 * weeks/months per year paid) is 60.89%.
[44] YieldMax Short N100 Option Income Strategy ETF [YQQQ]
YQQQ had total dividends of $5.0791 from 8/15/2024 to 12/5/2025. It has been active for 15.66 months. During that time frame it had a starting price of $19.64, a high price of $20.55, a low price of $11.93, and a 12/5/2025 price of $12.00. This means that it had a yield of 25.86%, or an average monthly yield of 1.65%. The peak-to-valley is -41.95%. The capital gains were -38.90%. The overall gain/loss (cap gains + yield) is -13.04%, or a gain/loss per month of -0.83%. The average volume since inception was 35,512.
YQQQ received a recent dividend of $0.0566 on 12/5/2025. This means the current yield ($0.0566 / $12.00 * weeks/months per year paid) is 24.53%.
[45] YieldMax ABNB Option Income Strategy ETF [ABNY]
ABNY had total dividends of $40.6429 from 6/25/2024 to 12/5/2025. It has been active for 17.33 months. During that time frame it had a starting price of $101.18, a high price of $107.45, a low price of $42.70, and a 12/5/2025 price of $45.20. This means that it had a yield of 40.17%, or an average monthly yield of 2.32%. The peak-to-valley is -60.26%. The capital gains were -55.33%. The overall gain/loss (cap gains + yield) is -15.16%, or a gain/loss per month of -0.87%. The average volume since inception was 18,168.
ABNY received a recent dividend of $0.4214 on 12/5/2025. This means the current yield ($0.4214 / $45.20 * weeks/months per year paid) is 48.48%.
[46] YieldMax MRNA Option Income Strategy ETF [MRNY]
MRNY had total dividends of $118.6312 from 10/24/2023 to 12/5/2025. It has been active for 25.36 months. During that time frame it had a starting price of $201.42, a high price of $260.00, a low price of $13.60, and a 12/5/2025 price of $15.27. This means that it had a yield of 58.90%, or an average monthly yield of 2.32%. The peak-to-valley is -94.77%. The capital gains were -92.42%. The overall gain/loss (cap gains + yield) is -33.52%, or a gain/loss per month of -1.32%. The average volume since inception was 947,392.
MRNY received a recent dividend of $0.2772 on 12/5/2025. This means the current yield ($0.2772 / $15.27 * weeks/months per year paid) is 94.40%.
[47] YieldMax AI Option Income Strategy ETF [AIYY]
AIYY had total dividends of $112.3881 from 11/28/2023 to 12/5/2025. It has been active for 24.23 months. During that time frame it had a starting price of $201.60, a high price of $216.94, a low price of $17.70, and a 12/5/2025 price of $19.68. This means that it had a yield of 55.75%, or an average monthly yield of 2.30%. The peak-to-valley is -91.84%. The capital gains were -90.24%. The overall gain/loss (cap gains + yield) is -34.49%, or a gain/loss per month of -1.42%. The average volume since inception was 664,925.
AIYY received a recent dividend of $0.3771 on 12/5/2025. This means the current yield ($0.3771 / $19.68 * weeks/months per year paid) is 99.64%.
[48] YieldMax SMCI Option Income Strategy ETF [SMCY]
SMCY had total dividends of $28.3052 from 9/12/2024 to 12/5/2025. It has been active for 14.76 months. During that time frame it had a starting price of $50.62, a high price of $59.20, a low price of $8.88, and a 12/5/2025 price of $9.57. This means that it had a yield of 55.92%, or an average monthly yield of 3.79%. The peak-to-valley is -85.00%. The capital gains were -81.09%. The overall gain/loss (cap gains + yield) is -25.18%, or a gain/loss per month of -1.71%. The average volume since inception was 564,952.
SMCY received a recent dividend of $0.2135 on 12/5/2025. This means the current yield ($0.2135 / $9.57 * weeks/months per year paid) is 116.01%.
[49] YieldMax Short COIN Option Income Strategy ETF [FIAT]
FIAT had total dividends of $114.9288 from 7/10/2024 to 12/5/2025. It has been active for 16.82 months. During that time frame it had a starting price of $200.07, a high price of $231.70, a low price of $22.80, and a 12/5/2025 price of $25.36. This means that it had a yield of 57.44%, or an average monthly yield of 3.41%. The peak-to-valley is -90.16%. The capital gains were -87.32%. The overall gain/loss (cap gains + yield) is -29.88%, or a gain/loss per month of -1.78%. The average volume since inception was 741,563.
FIAT received a recent dividend of $0.3988 on 12/5/2025. This means the current yield ($0.3988 / $25.36 * weeks/months per year paid) is 81.77%.
[50] YieldMax GME Option Income Strategy ETF [GMEY]
GMEY had total dividends of $6.3903 from 9/9/2025 to 12/5/2025. It has been active for 2.85 months. During that time frame it had a starting price of $50.43, a high price of $56.15, a low price of $39.15, and a 12/5/2025 price of $41.26. This means that it had a yield of 12.67%, or an average monthly yield of 4.44%. The peak-to-valley is -30.28%. The capital gains were -18.18%. The overall gain/loss (cap gains + yield) is -5.51%, or a gain/loss per month of -1.93%. The average volume since inception was 17,295.
GMEY received a recent dividend of $1.0160 on 12/5/2025. This means the current yield ($1.0160 / $41.26 * weeks/months per year paid) is 128.05%.
[51] YieldMax Short TSLA Option Income Strategy ETF [CRSH]
CRSH had total dividends of $93.1534 from 5/2/2024 to 12/5/2025. It has been active for 19.1 months. During that time frame it had a starting price of $200.87, a high price of $220.60, a low price of $25.90, and a 12/5/2025 price of $26.05. This means that it had a yield of 46.37%, or an average monthly yield of 2.43%. The peak-to-valley is -88.26%. The capital gains were -87.03%. The overall gain/loss (cap gains + yield) is -40.66%, or a gain/loss per month of -2.13%. The average volume since inception was 279,230.
CRSH received a recent dividend of $0.3334 on 12/5/2025. This means the current yield ($0.3334 / $26.05 * weeks/months per year paid) is 66.55%.
[52] YieldMax Short NVDA Option Income Strategy ETF [DIPS]
DIPS had total dividends of $79.2848 from 7/24/2024 to 12/5/2025. It has been active for 16.36 months. During that time frame it had a starting price of $206.94, a high price of $242.62, a low price of $49.80, and a 12/5/2025 price of $54.02. This means that it had a yield of 38.31%, or an average monthly yield of 2.34%. The peak-to-valley is -79.47%. The capital gains were -73.90%. The overall gain/loss (cap gains + yield) is -35.58%, or a gain/loss per month of -2.17%. The average volume since inception was 66,415.
DIPS received a recent dividend of $0.7548 on 12/5/2025. This means the current yield ($0.7548 / $54.02 * weeks/months per year paid) is 72.66%.
[53] YieldMax RBLX Option Income Strategy ETF [RBLY]
RBLY had total dividends of $9.7967 from 7/29/2025 to 12/5/2025. It has been active for 4.2 months. During that time frame it had a starting price of $49.34, a high price of $58.42, a low price of $32.76, and a 12/5/2025 price of $34.50. This means that it had a yield of 19.86%, or an average monthly yield of 4.73%. The peak-to-valley is -43.92%. The capital gains were -30.08%. The overall gain/loss (cap gains + yield) is -10.22%, or a gain/loss per month of -2.44%. The average volume since inception was 15,597.
RBLY received a recent dividend of $0.7051 on 12/5/2025. This means the current yield ($0.7051 / $34.50 * weeks/months per year paid) is 106.28%.
[54] YieldMax RDDT Option Income Strategy ETF [RDYY]
RDYY had total dividends of $7.4032 from 9/9/2025 to 12/5/2025. It has been active for 2.85 months. During that time frame it had a starting price of $51.29, a high price of $55.89, a low price of $34.17, and a 12/5/2025 price of $39.96. This means that it had a yield of 14.43%, or an average monthly yield of 5.06%. The peak-to-valley is -38.86%. The capital gains were -22.09%. The overall gain/loss (cap gains + yield) is -7.66%, or a gain/loss per month of -2.68%. The average volume since inception was 24,028.
RDYY received a recent dividend of $0.9603 on 12/5/2025. This means the current yield ($0.9603 / $39.96 * weeks/months per year paid) is 124.96%.
[55] YieldMax MARA Option Income Strategy ETF [MARO]
MARO had total dividends of $20.7653 from 12/10/2024 to 12/5/2025. It has been active for 11.82 months. During that time frame it had a starting price of $47.14, a high price of $53.06, a low price of $8.67, and a 12/5/2025 price of $9.74. This means that it had a yield of 44.05%, or an average monthly yield of 3.73%. The peak-to-valley is -83.66%. The capital gains were -79.34%. The overall gain/loss (cap gains + yield) is -35.29%, or a gain/loss per month of -2.98%. The average volume since inception was 173,492.
MARO received a recent dividend of $0.2439 on 12/5/2025. This means the current yield ($0.2439 / $9.74 * weeks/months per year paid) is 130.21%.
[56] YieldMax Ultra Short Option Income Strategy ETF [SLTY]
SLTY had total dividends of $8.2684 from 8/21/2025 to 12/5/2025. It has been active for 3.46 months. During that time frame it had a starting price of $49.96, a high price of $50.47, a low price of $34.66, and a 12/5/2025 price of $34.98. This means that it had a yield of 16.55%, or an average monthly yield of 4.78%. The peak-to-valley is -31.33%. The capital gains were -29.98%. The overall gain/loss (cap gains + yield) is -13.43%, or a gain/loss per month of -3.88%. The average volume since inception was 56,608.
SLTY received a recent dividend of $0.4265 on 12/4/2025. This means the current yield ($0.4265 / $34.98 * weeks/months per year paid) is 63.40%.
[57] YieldMax DKNG Option Income Strategy ETF [DRAY]
DRAY had total dividends of $8.9303 from 7/15/2025 to 12/5/2025. It has been active for 4.66 months. During that time frame it had a starting price of $50.09, a high price of $53.95, a low price of $27.56, and a 12/5/2025 price of $31.92. This means that it had a yield of 17.83%, or an average monthly yield of 3.83%. The peak-to-valley is -48.92%. The capital gains were -36.27%. The overall gain/loss (cap gains + yield) is -18.45%, or a gain/loss per month of -3.96%. The average volume since inception was 15,865.
DRAY received a recent dividend of $0.6739 on 12/5/2025. This means the current yield ($0.6739 / $31.92 * weeks/months per year paid) is 109.78%.
[58] YieldMax HIMS Option Income Strategy ETF [HIYY]
HIYY had total dividends of $6.5374 from 9/23/2025 to 12/5/2025. It has been active for 2.39 months. During that time frame it had a starting price of $48.32, a high price of $53.97, a low price of $26.70, and a 12/5/2025 price of $29.31. This means that it had a yield of 13.53%, or an average monthly yield of 5.65%. The peak-to-valley is -50.53%. The capital gains were -39.34%. The overall gain/loss (cap gains + yield) is -25.81%, or a gain/loss per month of -10.78%. The average volume since inception was 24,880.
HIYY received a recent dividend of $0.6754 on 12/5/2025. This means the current yield ($0.6754 / $29.31 * weeks/months per year paid) is 119.83%.
[59] YieldMax CRCL Option Income Strategy ETF [CRCO]
CRCO had total dividends of $7.4914 from 9/30/2025 to 12/5/2025. It has been active for 2.16 months. During that time frame it had a starting price of $49.21, a high price of $57.31, a low price of $21.84, and a 12/5/2025 price of $26.42. This means that it had a yield of 15.22%, or an average monthly yield of 7.03%. The peak-to-valley is -61.89%. The capital gains were -46.31%. The overall gain/loss (cap gains + yield) is -31.09%, or a gain/loss per month of -14.36%. The average volume since inception was 50,145.
CRCO received a recent dividend of $0.6077 on 12/5/2025. This means the current yield ($0.6077 / $26.42 * weeks/months per year paid) is 119.61%.
[60] YieldMax MSTR Performance & Distribution Tg 25 ETF [MSST]
MSST had total dividends of $0.2231 from 11/18/2025 to 12/5/2025. It has been active for 0.56 months. During that time frame it had a starting price of $53.14, a high price of $54.29, a low price of $41.57, and a 12/5/2025 price of $47.16. This means that it had a yield of 0.42%, or an average monthly yield of 0.75%. The peak-to-valley is -23.43%. The capital gains were -11.25%. The overall gain/loss (cap gains + yield) is -10.83%, or a gain/loss per month of -19.38%. The average volume since inception was 2,547.
MSST received a recent dividend of $0.2231 on 12/3/2025. This means the current yield ($0.2231 / $47.16 * weeks/months per year paid) is 24.60%.