
YIELDMAX -- Yield + Capital Gain Analysis 2/20/2026
A more realistic view of current yield trends

As always, please read our disclaimer. Important!
YieldMax’s Reverse Splits
Last year, YieldMax executed a massive reverse split across 15 of its products.
Rather than rehash the full discussion which we covered in detail here…

…we’ll simply note the practical issue: YieldMax has still not properly reverse-adjusted its dividend reporting — something most firms handle as a matter of course.
As a result, we are again skipping the affected products in this week’s analysis. They will not appear below.
Tickers excluded:
ABNY, AIYY, AMDY, CONY, CRSH, DIPS, FIAT, MRNY, MSTY, OARK, PYPY, TSLY, ULTY, XYZY, YBIT
The Current Yield Conundrum
We recently published a post on NAV erosion that directly addresses reverse-split dynamics in the covered-call ETF space.
No need to repeat it all here — but that post is worth reading:

The core point of the post is simple:
If an ETF pays massive distributions, that money must come from somewhere.
Covered-call ETFs are marketed as generating income from option premiums.
In practice, many also rely heavily on Return of Capital (ROC) — meaning part of the “distribution” is simply your own money being handed back to you to inflate the headline yield.
ROC functions a bit like a reverse mortgage:
You receive steady payments
The underlying asset slowly deteriorates
With a reverse mortgage, everyone understands the bank eventually owns the house.
With covered-call ETFs + ROC, many investors don’t realize the same dynamic can apply: principal can erode while the fund continues mailing out large checks.
Investors see huge yields and assume they’ll keep both:
their original investment
all that income
But if distributions are largely ROC, NAV can fall as fast as — or faster than — payouts.
The result? Eye-popping distributions… and still a negative total return.
Which brings us back to the main takeaway of the post:
Current yield isn’t necessarily what everyone thinks it is.
Do check out the post:
YieldMax General Info
Given the continued popularity of YieldMax, we’re continuing to evaluate all of their products based on a more meaningful metric:
Yield + Capital Gain
Almost all YieldMax funds have now transitioned to a weekly pay model. The only exceptions (for now) are:
BIGY
RNTY
SOXY
Those remain monthly payers.
We are keeping YieldMax separate from the broader weekly-payer universe — because covering 100+ stocks in one post is simply too much.
If you want to see the rest of the weekly payer universe, that is available here:
Analysis Tables
Here is some useful data:
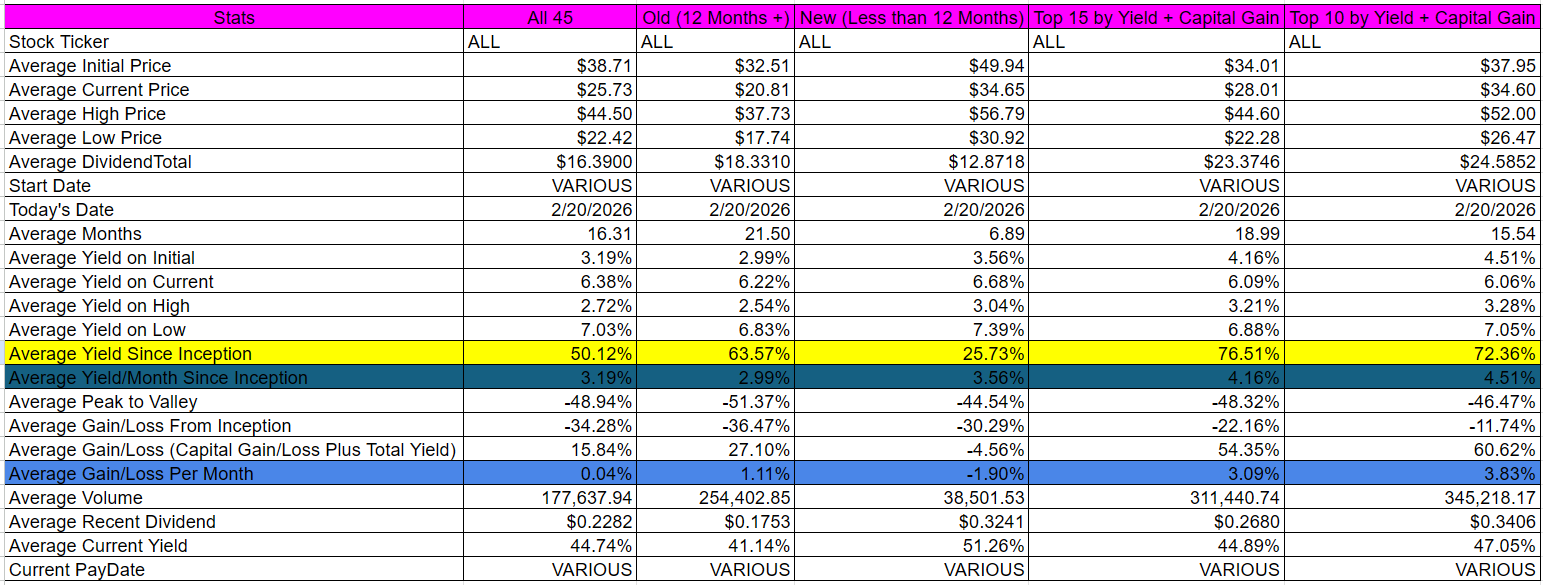
First, an averages table for all YieldMax products covered in this post. The columns from left-to-right are:
All 45 products
All products with GREATER than 12 months of performance history
All products with LESS than 12 months of performance history
Top 15 by yield + capital gain
Top 10 by yield + capital gain
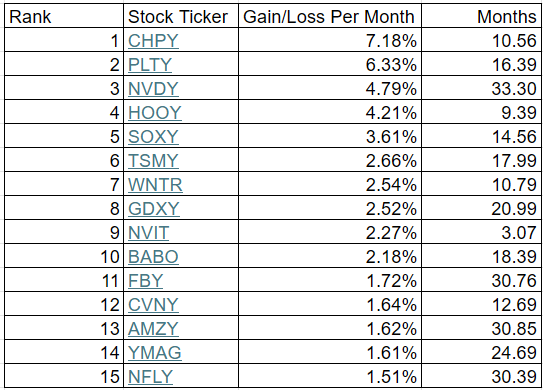
Second, a Top 15 list by yield + capital gain normalized by months in existence
Important notes:
Figures in the Top 15 list are yield + capital gain normalized by months in existence
(Total yield + total capital gain) ÷ months since inception
This is NOT current yield
All data is calculated since inception
These reflect full historical records — not necessarily current trends
Dividends are calculated using the Ex-EFF Date
Support the Work
This is a free post.
If you find this analysis useful and want to see more of what we’re building, consider a paid subscription:
$5/month or $60/year
Or if you don’t want a subscription but still found this useful — send us a coffee or beer!

Also of note:
We just completed our January run:
26 sectors
647 dividend-paying stocks
You can find an index to all of the January Run posts here:

As well as our February coverage of 12 companies specializing in dividend-paying ETFs (Roundhill, Amplify, Neos, and others):

In other words… it’s a good time to sign up for a paid subscription.
Tons of dividend data. Just $5/month:
Individual Stock Analysis (45 Entries)
In the list of individual stocks below, everything is sorted by descending yield + capital gain (bolded in each first paragraph). This is a far more useful metric than current yield alone.
Current yield is still listed — just not prioritized.
And before jumping headfirst into The River of Current Yield, make sure to read the full first paragraph of each entry.
Fair warning.
Occasionally, we may hold positions in some of these stocks.
[1] YieldMax Semiconductor Portfolio Option Income ETF [CHPY]
CHPY had total dividends of $19.2921 from 4/3/2025 to 2/20/2026. It has been active for 10.56 months. During that time frame it had a starting price of $45.65, a high price of $62.04, a low price of $40.40, and a 2/20/2026 price of $60.95. This means that it had a yield of 42.26%, or an average monthly yield of 4.00%. The peak-to-valley is -34.88%. The capital gains were 33.52%. The overall gain/loss (cap gains + yield) is 75.78%, or a gain/loss per month of 7.18%. The average volume since inception was 89,613.
CHPY received a recent dividend of $0.5259 on 2/19/2026. This means the current yield ($0.5259 / $60.95 * weeks/months per year paid) is 44.87%.
[2] YieldMax PLTR Option Income Strategy ETF [PLTY]
PLTY had total dividends of $66.7664 from 10/8/2024 to 2/20/2026. It has been active for 16.39 months. During that time frame it had a starting price of $51.43, a high price of $95.08, a low price of $36.08, and a 2/20/2026 price of $38.00. This means that it had a yield of 129.82%, or an average monthly yield of 7.92%. The peak-to-valley is -62.05%. The capital gains were -26.11%. The overall gain/loss (cap gains + yield) is 103.71%, or a gain/loss per month of 6.33%. The average volume since inception was 320,783.
PLTY received a recent dividend of $0.3865 on 2/20/2026. This means the current yield ($0.3865 / $38.00 * weeks/months per year paid) is 52.89%.
[3] YieldMax NVDA Option Income Strategy ETF [NVDY]
NVDY had total dividends of $37.5509 from 5/11/2023 to 2/20/2026. It has been active for 33.3 months. During that time frame it had a starting price of $19.91, a high price of $31.77, a low price of $12.47, and a 2/20/2026 price of $14.13. This means that it had a yield of 188.60%, or an average monthly yield of 5.66%. The peak-to-valley is -60.75%. The capital gains were -29.03%. The overall gain/loss (cap gains + yield) is 159.57%, or a gain/loss per month of 4.79%. The average volume since inception was 2,285,553.
NVDY received a recent dividend of $0.0944 on 2/20/2026. This means the current yield ($0.0944 / $14.13 * weeks/months per year paid) is 34.74%.
[4] YieldMax HOOD Option Income Strategy ETF [HOOY]
HOOY had total dividends of $42.9270 from 5/8/2025 to 2/20/2026. It has been active for 9.39 months. During that time frame it had a starting price of $52.82, a high price of $80.99, a low price of $29.00, and a 2/20/2026 price of $30.78. This means that it had a yield of 81.27%, or an average monthly yield of 8.65%. The peak-to-valley is -64.19%. The capital gains were -41.73%. The overall gain/loss (cap gains + yield) is 39.54%, or a gain/loss per month of 4.21%. The average volume since inception was 192,129.
HOOY received a recent dividend of $0.3306 on 2/20/2026. This means the current yield ($0.3306 / $30.78 * weeks/months per year paid) is 55.85%.
[5] YieldMax Target 12 Semiconductor Option Inc ETF [SOXY]
SOXY had total dividends of $7.4910 from 12/3/2024 to 2/20/2026. It has been active for 14.56 months. During that time frame it had a starting price of $50.10, a high price of $69.38, a low price of $35.02, and a 2/20/2026 price of $68.91. This means that it had a yield of 14.95%, or an average monthly yield of 1.03%. The peak-to-valley is -49.52%. The capital gains were 37.54%. The overall gain/loss (cap gains + yield) is 52.50%, or a gain/loss per month of 3.61%. The average volume since inception was 5,135.
SOXY received a recent dividend of $0.6713 on 2/5/2026. This means the current yield ($0.6713 / $68.91 * weeks/months per year paid) is 11.69%.
[6] YieldMax TSM Option Income Strategy ETF [TSMY]
TSMY had total dividends of $12.4634 from 8/21/2024 to 2/20/2026. It has been active for 17.99 months. During that time frame it had a starting price of $20.03, a high price of $22.31, a low price of $12.10, and a 2/20/2026 price of $17.14. This means that it had a yield of 62.22%, or an average monthly yield of 3.46%. The peak-to-valley is -45.76%. The capital gains were -14.43%. The overall gain/loss (cap gains + yield) is 47.80%, or a gain/loss per month of 2.66%. The average volume since inception was 83,308.
TSMY received a recent dividend of $0.1427 on 2/20/2026. This means the current yield ($0.1427 / $17.14 * weeks/months per year paid) is 43.29%.
[7] YieldMax MSTR Short Option Income Strategy ETF [WNTR]
WNTR had total dividends of $27.5736 from 3/27/2025 to 2/20/2026. It has been active for 10.79 months. During that time frame it had a starting price of $50.06, a high price of $60.64, a low price of $27.24, and a 2/20/2026 price of $36.22. This means that it had a yield of 55.08%, or an average monthly yield of 5.11%. The peak-to-valley is -55.08%. The capital gains were -27.65%. The overall gain/loss (cap gains + yield) is 27.43%, or a gain/loss per month of 2.54%. The average volume since inception was 128,793.
WNTR received a recent dividend of $0.7318 on 2/20/2026. This means the current yield ($0.7318 / $36.22 * weeks/months per year paid) is 105.06%.
[8] YieldMax Gold Miners Option Income Strategy ETF [GDXY]
GDXY had total dividends of $13.1734 from 5/21/2024 to 2/20/2026. It has been active for 20.99 months. During that time frame it had a starting price of $19.85, a high price of $19.98, a low price of $14.18, and a 2/20/2026 price of $17.17. This means that it had a yield of 66.36%, or an average monthly yield of 3.16%. The peak-to-valley is -29.03%. The capital gains were -13.50%. The overall gain/loss (cap gains + yield) is 52.86%, or a gain/loss per month of 2.52%. The average volume since inception was 269,100.
GDXY received a recent dividend of $0.1938 on 2/20/2026. This means the current yield ($0.1938 / $17.17 * weeks/months per year paid) is 58.69%.
[9] YieldMax NVDA Performance Distribution Target 25 ETF [NVIT]
NVIT had total dividends of $2.8410 from 11/18/2025 to 2/20/2026. It has been active for 3.07 months. During that time frame it had a starting price of $49.25, a high price of $52.27, a low price of $45.67, and a 2/20/2026 price of $49.83. This means that it had a yield of 5.77%, or an average monthly yield of 1.88%. The peak-to-valley is -12.63%. The capital gains were 1.18%. The overall gain/loss (cap gains + yield) is 6.95%, or a gain/loss per month of 2.27%. The average volume since inception was 3,882.
NVIT received a recent dividend of $0.2322 on 2/19/2026. This means the current yield ($0.2322 / $49.83 * weeks/months per year paid) is 24.23%.
[10] YieldMax BABA Option Income Strategy ETF [BABO]
BABO had total dividends of $15.7736 from 8/8/2024 to 2/20/2026. It has been active for 18.39 months. During that time frame it had a starting price of $20.42, a high price of $25.53, a low price of $12.55, and a 2/20/2026 price of $12.82. This means that it had a yield of 77.25%, or an average monthly yield of 4.20%. The peak-to-valley is -50.84%. The capital gains were -37.22%. The overall gain/loss (cap gains + yield) is 40.03%, or a gain/loss per month of 2.18%. The average volume since inception was 73,888.
BABO received a recent dividend of $0.0965 on 2/20/2026. This means the current yield ($0.0965 / $12.82 * weeks/months per year paid) is 39.14%.
[11] YieldMax META Option Income Strategy ETF [FBY]
FBY had total dividends of $19.7654 from 7/28/2023 to 2/20/2026. It has been active for 30.76 months. During that time frame it had a starting price of $20.63, a high price of $24.49, a low price of $11.42, and a 2/20/2026 price of $11.75. This means that it had a yield of 95.81%, or an average monthly yield of 3.12%. The peak-to-valley is -53.37%. The capital gains were -43.04%. The overall gain/loss (cap gains + yield) is 52.76%, or a gain/loss per month of 1.72%. The average volume since inception was 123,804.
FBY received a recent dividend of $0.0812 on 2/20/2026. This means the current yield ($0.0812 / $11.75 * weeks/months per year paid) is 35.94%.
[12] YieldMax CVNA Option Income Strategy ETF [CVNY]
CVNY had total dividends of $32.3133 from 1/30/2025 to 2/20/2026. It has been active for 12.69 months. During that time frame it had a starting price of $50.00, a high price of $58.17, a low price of $24.83, and a 2/20/2026 price of $28.10. This means that it had a yield of 64.63%, or an average monthly yield of 5.09%. The peak-to-valley is -57.31%. The capital gains were -43.80%. The overall gain/loss (cap gains + yield) is 20.83%, or a gain/loss per month of 1.64%. The average volume since inception was 64,959.
CVNY received a recent dividend of $0.2744 on 2/20/2026. This means the current yield ($0.2744 / $28.10 * weeks/months per year paid) is 50.78%.
[13] YieldMax AMZN Option Income Strategy ETF [AMZY]
AMZY had total dividends of $18.7067 from 7/25/2023 to 2/20/2026. It has been active for 30.85 months. During that time frame it had a starting price of $20.05, a high price of $24.10, a low price of $10.91, and a 2/20/2026 price of $11.35. This means that it had a yield of 93.30%, or an average monthly yield of 3.02%. The peak-to-valley is -54.73%. The capital gains were -43.39%. The overall gain/loss (cap gains + yield) is 49.91%, or a gain/loss per month of 1.62%. The average volume since inception was 302,701.
AMZY received a recent dividend of $0.0875 on 2/20/2026. This means the current yield ($0.0875 / $11.35 * weeks/months per year paid) is 40.09%.
[14] YieldMax Magnificent 7 Fund of Option Income ETFs [YMAG]
YMAG had total dividends of $14.7973 from 1/30/2024 to 2/20/2026. It has been active for 24.69 months. During that time frame it had a starting price of $19.89, a high price of $21.91, a low price of $12.70, and a 2/20/2026 price of $13.01. This means that it had a yield of 74.40%, or an average monthly yield of 3.01%. The peak-to-valley is -42.04%. The capital gains were -34.59%. The overall gain/loss (cap gains + yield) is 39.81%, or a gain/loss per month of 1.61%. The average volume since inception was 606,250.
YMAG received a recent dividend of $0.1076 on 2/19/2026. This means the current yield ($0.1076 / $13.01 * weeks/months per year paid) is 43.01%.
[15] YieldMax NFLX Option Income Strategy ETF [NFLY]
NFLY had total dividends of $19.1833 from 8/8/2023 to 2/20/2026. It has been active for 30.39 months. During that time frame it had a starting price of $19.99, a high price of $20.36, a low price of $9.66, and a 2/20/2026 price of $9.97. This means that it had a yield of 95.96%, or an average monthly yield of 3.16%. The peak-to-valley is -52.55%. The capital gains were -50.13%. The overall gain/loss (cap gains + yield) is 45.84%, or a gain/loss per month of 1.51%. The average volume since inception was 121,715.
NFLY received a recent dividend of $0.0634 on 2/20/2026. This means the current yield ($0.0634 / $9.97 * weeks/months per year paid) is 33.07%.
[16] YieldMax SNOW Option Income Strategy ETF [SNOY]
SNOY had total dividends of $16.9587 from 6/11/2024 to 2/20/2026. It has been active for 20.3 months. During that time frame it had a starting price of $20.18, a high price of $23.76, a low price of $8.50, and a 2/20/2026 price of $9.12. This means that it had a yield of 84.04%, or an average monthly yield of 4.14%. The peak-to-valley is -64.23%. The capital gains were -54.81%. The overall gain/loss (cap gains + yield) is 29.23%, or a gain/loss per month of 1.44%. The average volume since inception was 110,860.
SNOY received a recent dividend of $0.0919 on 2/20/2026. This means the current yield ($0.0919 / $9.12 * weeks/months per year paid) is 52.40%.
[17] YieldMax Russell 2000 0DTE Covered Call Strat ETF [RDTY]
RDTY had total dividends of $16.3182 from 3/6/2025 to 2/20/2026. It has been active for 11.46 months. During that time frame it had a starting price of $49.21, a high price of $50.07, a low price of $39.16, and a 2/20/2026 price of $40.27. This means that it had a yield of 33.16%, or an average monthly yield of 2.89%. The peak-to-valley is -21.79%. The capital gains were -18.17%. The overall gain/loss (cap gains + yield) is 14.99%, or a gain/loss per month of 1.31%. The average volume since inception was 7,453.
RDTY received a recent dividend of $0.3392 on 2/19/2026. This means the current yield ($0.3392 / $40.27 * weeks/months per year paid) is 43.80%.
[18] YieldMax GOOGL Option Income Strategy ETF [GOOY]
GOOY had total dividends of $13.7313 from 7/28/2023 to 2/20/2026. It has been active for 30.76 months. During that time frame it had a starting price of $20.50, a high price of $20.83, a low price of $10.89, and a 2/20/2026 price of $14.02. This means that it had a yield of 66.98%, or an average monthly yield of 2.18%. The peak-to-valley is -47.72%. The capital gains were -31.61%. The overall gain/loss (cap gains + yield) is 35.37%, or a gain/loss per month of 1.15%. The average volume since inception was 178,952.
GOOY received a recent dividend of $0.1017 on 2/20/2026. This means the current yield ($0.1017 / $14.02 * weeks/months per year paid) is 37.72%.
[19] YieldMax Target 12 Big 50 Option Income ETF [BIGY]
BIGY had total dividends of $7.0880 from 11/21/2024 to 2/20/2026. It has been active for 14.99 months. During that time frame it had a starting price of $50.15, a high price of $54.64, a low price of $40.00, and a 2/20/2026 price of $51.05. This means that it had a yield of 14.13%, or an average monthly yield of 0.94%. The peak-to-valley is -26.79%. The capital gains were 1.79%. The overall gain/loss (cap gains + yield) is 15.93%, or a gain/loss per month of 1.06%. The average volume since inception was 6,617.
BIGY received a recent dividend of $0.5276 on 2/5/2026. This means the current yield ($0.5276 / $51.05 * weeks/months per year paid) is 12.40%.
[20] YieldMax JPM Option Income Strategy ETF [JPMO]
JPMO had total dividends of $11.5075 from 9/12/2023 to 2/20/2026. It has been active for 29.26 months. During that time frame it had a starting price of $20.06, a high price of $22.30, a low price of $13.64, and a 2/20/2026 price of $14.71. This means that it had a yield of 57.37%, or an average monthly yield of 1.96%. The peak-to-valley is -38.83%. The capital gains were -26.67%. The overall gain/loss (cap gains + yield) is 30.70%, or a gain/loss per month of 1.05%. The average volume since inception was 28,940.
JPMO received a recent dividend of $0.0571 on 2/20/2026. This means the current yield ($0.0571 / $14.71 * weeks/months per year paid) is 20.18%.
[21] YieldMax Target 12 Real Estate Option Income ETF [RNTY]
RNTY had total dividends of $4.5394 from 4/17/2025 to 2/20/2026. It has been active for 10.1 months. During that time frame it had a starting price of $50.86, a high price of $53.02, a low price of $48.47, and a 2/20/2026 price of $51.66. This means that it had a yield of 8.93%, or an average monthly yield of 0.88%. The peak-to-valley is -8.58%. The capital gains were 1.57%. The overall gain/loss (cap gains + yield) is 10.50%, or a gain/loss per month of 1.04%. The average volume since inception was 1,647.
RNTY received a recent dividend of $0.4951 on 2/5/2026. This means the current yield ($0.4951 / $51.66 * weeks/months per year paid) is 11.50%.
[22] YieldMax MSFT Option Income Strategy ETF [MSFO]
MSFO had total dividends of $13.5642 from 8/25/2023 to 2/20/2026. It has been active for 29.85 months. During that time frame it had a starting price of $20.18, a high price of $23.48, a low price of $12.55, and a 2/20/2026 price of $12.72. This means that it had a yield of 67.22%, or an average monthly yield of 2.25%. The peak-to-valley is -46.55%. The capital gains were -36.97%. The overall gain/loss (cap gains + yield) is 30.25%, or a gain/loss per month of 1.01%. The average volume since inception was 64,787.
MSFO received a recent dividend of $0.0739 on 2/20/2026. This means the current yield ($0.0739 / $12.72 * weeks/months per year paid) is 30.21%.
[23] YieldMax TSLA Performance Distribution Target 25 ETF [TEST]
TEST had total dividends of $3.0290 from 11/18/2025 to 2/20/2026. It has been active for 3.07 months. During that time frame it had a starting price of $49.66, a high price of $57.74, a low price of $46.10, and a 2/20/2026 price of $48.07. This means that it had a yield of 6.10%, or an average monthly yield of 1.99%. The peak-to-valley is -20.16%. The capital gains were -3.20%. The overall gain/loss (cap gains + yield) is 2.90%, or a gain/loss per month of 0.95%. The average volume since inception was 3,009.
TEST received a recent dividend of $0.2338 on 2/19/2026. This means the current yield ($0.2338 / $48.07 * weeks/months per year paid) is 25.29%.
[24] YieldMax Universe Fund of Option Income ETFs [YMAX]
YMAX had total dividends of $15.9149 from 1/17/2024 to 2/20/2026. It has been active for 25.1 months. During that time frame it had a starting price of $19.90, a high price of $21.94, a low price of $8.31, and a 2/20/2026 price of $8.48. This means that it had a yield of 79.97%, or an average monthly yield of 3.19%. The peak-to-valley is -62.12%. The capital gains were -57.39%. The overall gain/loss (cap gains + yield) is 22.59%, or a gain/loss per month of 0.90%. The average volume since inception was 1,431,255.
YMAX received a recent dividend of $0.0778 on 2/19/2026. This means the current yield ($0.0778 / $8.48 * weeks/months per year paid) is 47.71%.
[25] YieldMax AI & Tech Portfolio Option Income ETF [GPTY]
GPTY had total dividends of $16.4495 from 1/23/2025 to 2/20/2026. It has been active for 12.92 months. During that time frame it had a starting price of $50.09, a high price of $50.43, a low price of $32.92, and a 2/20/2026 price of $38.28. This means that it had a yield of 32.84%, or an average monthly yield of 2.54%. The peak-to-valley is -34.72%. The capital gains were -23.58%. The overall gain/loss (cap gains + yield) is 9.26%, or a gain/loss per month of 0.72%. The average volume since inception was 37,094.
GPTY received a recent dividend of $0.2619 on 2/19/2026. This means the current yield ($0.2619 / $38.28 * weeks/months per year paid) is 35.58%.
[26] YieldMax AAPL Option Income Strategy ETF [APLY]
APLY had total dividends of $12.5273 from 4/18/2023 to 2/20/2026. It has been active for 34.07 months. During that time frame it had a starting price of $20.20, a high price of $23.02, a low price of $11.72, and a 2/20/2026 price of $12.39. This means that it had a yield of 62.02%, or an average monthly yield of 1.82%. The peak-to-valley is -49.09%. The capital gains were -38.66%. The overall gain/loss (cap gains + yield) is 23.35%, or a gain/loss per month of 0.69%. The average volume since inception was 92,709.
APLY received a recent dividend of $0.0498 on 2/20/2026. This means the current yield ($0.0498 / $12.39 * weeks/months per year paid) is 20.90%.
[27] YieldMax S&P 500 0DTE Covered Call Strategy ETF [SDTY]
SDTY had total dividends of $11.2078 from 2/6/2025 to 2/20/2026. It has been active for 12.46 months. During that time frame it had a starting price of $50.29, a high price of $51.29, a low price of $38.59, and a 2/20/2026 price of $43.34. This means that it had a yield of 22.29%, or an average monthly yield of 1.79%. The peak-to-valley is -24.76%. The capital gains were -13.82%. The overall gain/loss (cap gains + yield) is 8.47%, or a gain/loss per month of 0.68%. The average volume since inception was 10,739.
SDTY received a recent dividend of $0.2327 on 2/19/2026. This means the current yield ($0.2327 / $43.34 * weeks/months per year paid) is 27.92%.
[28] YieldMax DIS Option Income Strategy ETF [DISO]
DISO had total dividends of $12.8872 from 8/25/2023 to 2/20/2026. It has been active for 29.85 months. During that time frame it had a starting price of $20.16, a high price of $22.69, a low price of $10.59, and a 2/20/2026 price of $10.99. This means that it had a yield of 63.92%, or an average monthly yield of 2.14%. The peak-to-valley is -53.33%. The capital gains were -45.49%. The overall gain/loss (cap gains + yield) is 18.44%, or a gain/loss per month of 0.62%. The average volume since inception was 15,922.
DISO received a recent dividend of $0.0759 on 2/20/2026. This means the current yield ($0.0759 / $10.99 * weeks/months per year paid) is 35.91%.
[29] YieldMax Nasdaq 100 0DTE Covered Call Strategy ETF [QDTY]
QDTY had total dividends of $13.4096 from 2/13/2025 to 2/20/2026. It has been active for 12.23 months. During that time frame it had a starting price of $50.61, a high price of $52.55, a low price of $36.76, and a 2/20/2026 price of $40.80. This means that it had a yield of 26.50%, or an average monthly yield of 2.17%. The peak-to-valley is -30.05%. The capital gains were -19.38%. The overall gain/loss (cap gains + yield) is 7.11%, or a gain/loss per month of 0.58%. The average volume since inception was 11,503.
QDTY received a recent dividend of $0.3057 on 2/19/2026. This means the current yield ($0.3057 / $40.80 * weeks/months per year paid) is 38.96%.
[30] YieldMax XOM Option Income Strategy ETF [XOMO]
XOMO had total dividends of $9.3163 from 8/31/2023 to 2/20/2026. It has been active for 29.66 months. During that time frame it had a starting price of $20.01, a high price of $23.38, a low price of $11.32, and a 2/20/2026 price of $12.83. This means that it had a yield of 46.56%, or an average monthly yield of 1.57%. The peak-to-valley is -51.58%. The capital gains were -35.88%. The overall gain/loss (cap gains + yield) is 10.68%, or a gain/loss per month of 0.36%. The average volume since inception was 42,555.
XOMO received a recent dividend of $0.1126 on 2/20/2026. This means the current yield ($0.1126 / $12.83 * weeks/months per year paid) is 45.64%.
[31] YieldMax BRK B Option Income Strategy ETF [BRKC]
BRKC had total dividends of $5.9265 from 6/5/2025 to 2/20/2026. It has been active for 8.49 months. During that time frame it had a starting price of $49.68, a high price of $50.66, a low price of $42.45, and a 2/20/2026 price of $43.97. This means that it had a yield of 11.93%, or an average monthly yield of 1.40%. The peak-to-valley is -16.21%. The capital gains were -11.49%. The overall gain/loss (cap gains + yield) is 0.44%, or a gain/loss per month of 0.05%. The average volume since inception was 10,944.
BRKC received a recent dividend of $0.1479 on 2/20/2026. This means the current yield ($0.1479 / $43.97 * weeks/months per year paid) is 17.49%.
[32] YieldMax Short N100 Option Income Strategy ETF [YQQQ]
YQQQ had total dividends of $5.6088 from 8/15/2024 to 2/20/2026. It has been active for 18.16 months. During that time frame it had a starting price of $19.64, a high price of $20.55, a low price of $11.79, and a 2/20/2026 price of $12.25. This means that it had a yield of 28.56%, or an average monthly yield of 1.57%. The peak-to-valley is -42.63%. The capital gains were -37.63%. The overall gain/loss (cap gains + yield) is -9.07%, or a gain/loss per month of -0.50%. The average volume since inception was 37,392.
YQQQ received a recent dividend of $0.0681 on 2/20/2026. This means the current yield ($0.0681 / $12.25 * weeks/months per year paid) is 28.91%.
[33] YieldMax Crypto Industry & Tech Port Opt Inc ETF [LFGY]
LFGY had total dividends of $25.4866 from 1/14/2025 to 2/20/2026. It has been active for 13.2 months. During that time frame it had a starting price of $51.25, a high price of $55.11, a low price of $19.83, and a 2/20/2026 price of $21.05. This means that it had a yield of 49.73%, or an average monthly yield of 3.77%. The peak-to-valley is -64.02%. The capital gains were -58.93%. The overall gain/loss (cap gains + yield) is -9.20%, or a gain/loss per month of -0.70%. The average volume since inception was 140,617.
LFGY received a recent dividend of $0.2294 on 2/19/2026. This means the current yield ($0.2294 / $21.05 * weeks/months per year paid) is 56.67%.
[34] YieldMax Dorsey Wright Featured 5 Income ETF [FEAT]
FEAT had total dividends of $20.8967 from 12/17/2024 to 2/20/2026. It has been active for 14.1 months. During that time frame it had a starting price of $49.71, a high price of $50.21, a low price of $18.87, and a 2/20/2026 price of $19.95. This means that it had a yield of 42.04%, or an average monthly yield of 2.98%. The peak-to-valley is -62.42%. The capital gains were -59.87%. The overall gain/loss (cap gains + yield) is -17.83%, or a gain/loss per month of -1.26%. The average volume since inception was 25,331.
FEAT received a recent dividend of $0.2314 on 2/19/2026. This means the current yield ($0.2314 / $19.95 * weeks/months per year paid) is 60.31%.
[35] YieldMax Dorsey Wright Hybrid 5 Income ETF [FIVY]
FIVY had total dividends of $15.5305 from 12/17/2024 to 2/20/2026. It has been active for 14.1 months. During that time frame it had a starting price of $49.78, a high price of $52.51, a low price of $23.65, and a 2/20/2026 price of $25.29. This means that it had a yield of 31.20%, or an average monthly yield of 2.21%. The peak-to-valley is -54.96%. The capital gains were -49.20%. The overall gain/loss (cap gains + yield) is -18.00%, or a gain/loss per month of -1.28%. The average volume since inception was 10,007.
FIVY received a recent dividend of $0.1731 on 2/19/2026. This means the current yield ($0.1731 / $25.29 * weeks/months per year paid) is 35.59%.
[36] YieldMax SMCI Option Income Strategy ETF [SMCY]
SMCY had total dividends of $29.4704 from 9/12/2024 to 2/20/2026. It has been active for 17.26 months. During that time frame it had a starting price of $50.62, a high price of $59.20, a low price of $7.46, and a 2/20/2026 price of $7.98. This means that it had a yield of 58.22%, or an average monthly yield of 3.37%. The peak-to-valley is -87.40%. The capital gains were -84.24%. The overall gain/loss (cap gains + yield) is -26.02%, or a gain/loss per month of -1.51%. The average volume since inception was 691,107.
SMCY received a recent dividend of $0.1221 on 2/20/2026. This means the current yield ($0.1221 / $7.98 * weeks/months per year paid) is 79.56%.
[37] YieldMax GME Option Income Strategy ETF [GMEY]
GMEY had total dividends of $10.5028 from 9/9/2025 to 2/20/2026. It has been active for 5.36 months. During that time frame it had a starting price of $50.43, a high price of $56.15, a low price of $34.94, and a 2/20/2026 price of $35.68. This means that it had a yield of 20.83%, or an average monthly yield of 3.88%. The peak-to-valley is -37.77%. The capital gains were -29.25%. The overall gain/loss (cap gains + yield) is -8.42%, or a gain/loss per month of -1.57%. The average volume since inception was 11,333.
GMEY received a recent dividend of $0.3711 on 2/20/2026. This means the current yield ($0.3711 / $35.68 * weeks/months per year paid) is 54.08%.
[38] YieldMax Ultra Short Option Income Strategy ETF [SLTY]
SLTY had total dividends of $12.6528 from 8/21/2025 to 2/20/2026. It has been active for 5.99 months. During that time frame it had a starting price of $49.96, a high price of $50.47, a low price of $27.68, and a 2/20/2026 price of $28.81. This means that it had a yield of 25.33%, or an average monthly yield of 4.23%. The peak-to-valley is -45.16%. The capital gains were -42.33%. The overall gain/loss (cap gains + yield) is -17.01%, or a gain/loss per month of -2.84%. The average volume since inception was 46,305.
SLTY received a recent dividend of $0.3696 on 2/19/2026. This means the current yield ($0.3696 / $28.81 * weeks/months per year paid) is 66.71%.
[39] YieldMax MARA Option Income Strategy ETF [MARO]
MARO had total dividends of $22.0587 from 12/10/2024 to 2/20/2026. It has been active for 14.33 months. During that time frame it had a starting price of $47.14, a high price of $53.06, a low price of $5.05, and a 2/20/2026 price of $5.80. This means that it had a yield of 46.79%, or an average monthly yield of 3.27%. The peak-to-valley is -90.48%. The capital gains were -87.70%. The overall gain/loss (cap gains + yield) is -40.90%, or a gain/loss per month of -2.85%. The average volume since inception was 184,100.
MARO received a recent dividend of $0.0927 on 2/20/2026. This means the current yield ($0.0927 / $5.80 * weeks/months per year paid) is 83.11%.
[40] YieldMax RBLX Option Income Strategy ETF [RBLY]
RBLY had total dividends of $12.8558 from 7/29/2025 to 2/20/2026. It has been active for 6.72 months. During that time frame it had a starting price of $49.34, a high price of $58.42, a low price of $20.75, and a 2/20/2026 price of $21.42. This means that it had a yield of 26.06%, or an average monthly yield of 3.88%. The peak-to-valley is -64.48%. The capital gains were -56.59%. The overall gain/loss (cap gains + yield) is -30.53%, or a gain/loss per month of -4.54%. The average volume since inception was 12,213.
RBLY received a recent dividend of $0.3169 on 2/20/2026. This means the current yield ($0.3169 / $21.42 * weeks/months per year paid) is 76.93%.
[41] YieldMax DKNG Option Income Strategy ETF [DRAY]
DRAY had total dividends of $12.0192 from 7/15/2025 to 2/20/2026. It has been active for 7.16 months. During that time frame it had a starting price of $50.09, a high price of $53.95, a low price of $17.17, and a 2/20/2026 price of $19.71. This means that it had a yield of 24.00%, or an average monthly yield of 3.35%. The peak-to-valley is -68.17%. The capital gains were -60.65%. The overall gain/loss (cap gains + yield) is -36.66%, or a gain/loss per month of -5.12%. The average volume since inception was 13,171.
DRAY received a recent dividend of $0.2270 on 2/20/2026. This means the current yield ($0.2270 / $19.71 * weeks/months per year paid) is 59.89%.
[42] YieldMax RDDT Option Income Strategy ETF [RDYY]
RDYY had total dividends of $12.7596 from 9/9/2025 to 2/20/2026. It has been active for 5.36 months. During that time frame it had a starting price of $51.29, a high price of $56.57, a low price of $20.46, and a 2/20/2026 price of $22.80. This means that it had a yield of 24.88%, or an average monthly yield of 4.64%. The peak-to-valley is -63.83%. The capital gains were -55.55%. The overall gain/loss (cap gains + yield) is -30.67%, or a gain/loss per month of -5.72%. The average volume since inception was 33,959.
RDYY received a recent dividend of $0.2938 on 2/20/2026. This means the current yield ($0.2938 / $22.80 * weeks/months per year paid) is 67.01%.
[43] YieldMax CRCL Option Income Strategy ETF [CRCO]
CRCO had total dividends of $11.0382 from 9/30/2025 to 2/20/2026. It has been active for 4.69 months. During that time frame it had a starting price of $49.21, a high price of $57.31, a low price of $15.01, and a 2/20/2026 price of $17.77. This means that it had a yield of 22.43%, or an average monthly yield of 4.78%. The peak-to-valley is -73.81%. The capital gains were -63.89%. The overall gain/loss (cap gains + yield) is -41.46%, or a gain/loss per month of -8.84%. The average volume since inception was 41,190.
CRCO received a recent dividend of $0.2302 on 2/20/2026. This means the current yield ($0.2302 / $17.77 * weeks/months per year paid) is 67.36%.
[44] YieldMax MSTR Performance & Distribution Tg 25 ETF [MSST]
MSST had total dividends of $2.4317 from 11/18/2025 to 2/20/2026. It has been active for 3.07 months. During that time frame it had a starting price of $53.14, a high price of $54.29, a low price of $28.30, and a 2/20/2026 price of $34.49. This means that it had a yield of 4.58%, or an average monthly yield of 1.49%. The peak-to-valley is -47.87%. The capital gains were -35.10%. The overall gain/loss (cap gains + yield) is -30.52%, or a gain/loss per month of -9.96%. The average volume since inception was 1,999.
MSST received a recent dividend of $0.1693 on 2/19/2026. This means the current yield ($0.1693 / $34.49 * weeks/months per year paid) is 25.53%.
[45] YieldMax HIMS Option Income Strategy ETF [HIYY]
HIYY had total dividends of $9.2422 from 9/23/2025 to 2/20/2026. It has been active for 4.92 months. During that time frame it had a starting price of $48.32, a high price of $53.97, a low price of $11.88, and a 2/20/2026 price of $11.90. This means that it had a yield of 19.13%, or an average monthly yield of 3.89%. The peak-to-valley is -77.99%. The capital gains were -75.37%. The overall gain/loss (cap gains + yield) is -56.25%, or a gain/loss per month of -11.43%. The average volume since inception was 18,384.
HIYY received a recent dividend of $0.1706 on 2/20/2026. This means the current yield ($0.1706 / $11.90 * weeks/months per year paid) is 74.55%.