
YIELDMAX -- Yield + Capital Gain Analysis 5/29/2026
A more realistic view of current yield trends

As always, please read our disclaimer. Important!
YieldMax’s Reverse Splits
Last year YieldMax executed reverse splits across 15 of its products. We covered that split in detail here.
It is our policy is not to cover covered-call ETFs that have had reverse splits (if it got that bad, it probably won’t get better).
The affected tickers are excluded from this week’s analysis are:
ABNY, AIYY, AMDY, CONY, CRSH, DIPS, FIAT, MRNY, MSTY, OARK, PYPY, TSLY, ULTY, XYZY, YBIT
The Current Yield Conundrum
Covered-call ETFs are marketed on income from option premiums.
However, in practice, many also lean heavily on Return of Capital (ROC) — meaning part of the “distribution” is simply your own money being handed back to you to inflate the headline yield.
The dynamic is similar to a reverse mortgage: you receive steady payments while the underlying asset quietly deteriorates. But with a reverse mortgage, everyone knows the bank eventually owns the house.
With covered-call ETFs + ROC, many investors don’t realize the same logic can apply — NAV (Net Asset Value) can erode as fast as, or faster than, the payouts. The result: eye-popping distributions and still a negative total return.
A post worth reading before diving into the data:

About This Analysis
We evaluate all YieldMax products on Yield + Capital Gain — a more honest metric than current yield alone.
Almost all YieldMax funds have moved to weekly payouts. The exceptions — BIGY, RNTY, and SOXY — remain monthly payers.
For the broader weekly-payer universe check out: WEEKLY PAYERS — Yield + Capital Gain Analysis 5/26/2026
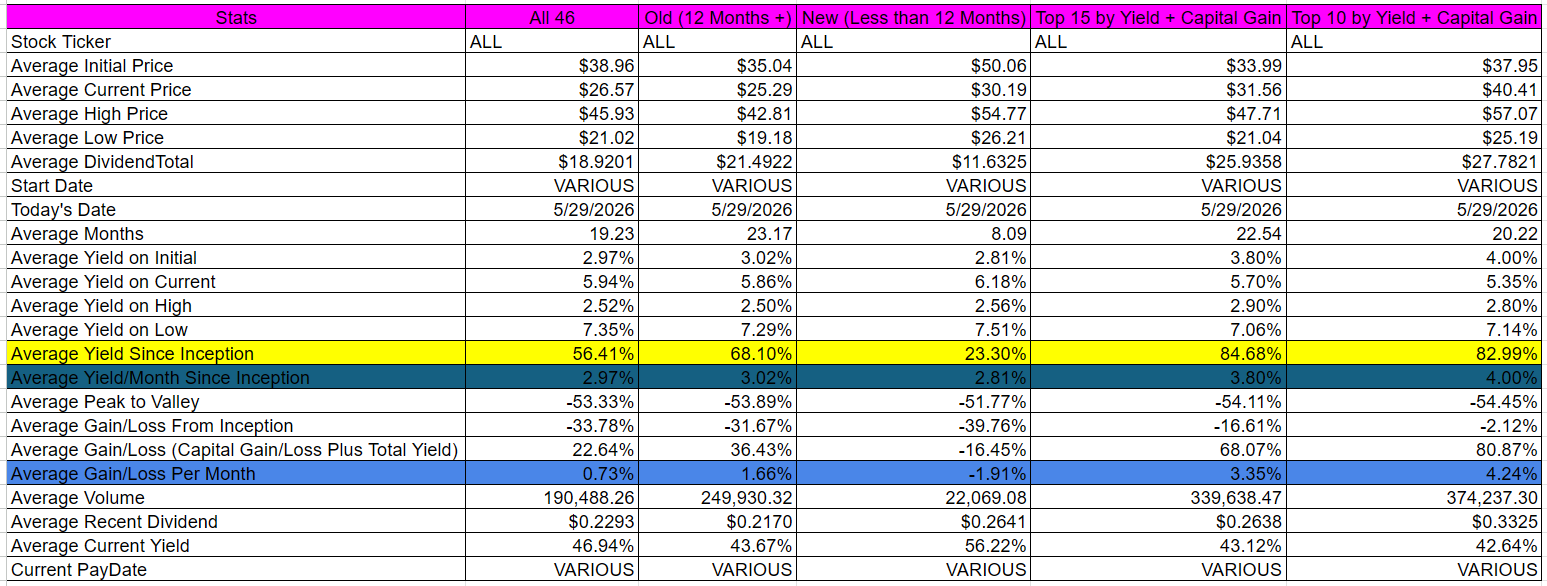
Analysis Tables
Averages table across five slices — all 46 products, those with more than 12 months of history, those with less, the Top 15, and the Top 10 by yield + capital gain:
Top 15 by yield + capital gain, normalized by months in existence:
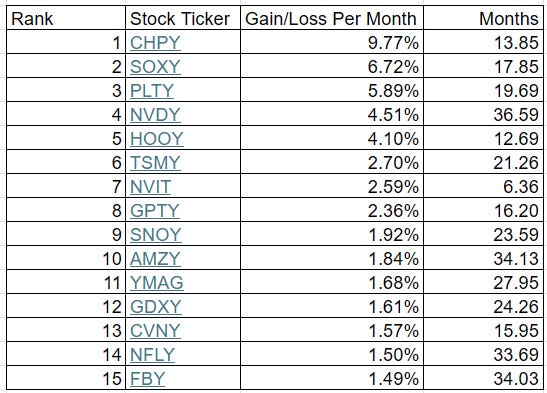
Methodology note:
Figures are (total yield + total capital gain) ÷ months since inception — not current yield
All data is calculated since inception
Dividends use the Ex-EFF Date
Support the Work
The April Run 2026 just wrapped — a good moment to jump in if you’ve been on the fence. Also check out our Company Index — another 200+ dividend paying ETFs we cover.
This is a free post; a paid subscription ($5/month or $60/year) goes directly toward keeping this analysis running.
Individual Stock Analysis (46 entries)
Sorted by descending yield + capital gain (bolded in each entry).
Current yield is listed but not prioritized (2nd paragraph of each entry).
Occasionally we may hold positions in some of these stocks.
[1] YieldMax Semiconductor Portfolio Option Income ETF [CHPY]
CHPY had total dividends of $26.6040 from 4/3/2025 to 5/29/2026. It has been active for 13.85 months. During that time frame it had a starting price of $45.65, a high price of $82.75, a low price of $40.40, and a 5/29/2026 price of $80.85. This means that it had a yield of 58.28%, or an average monthly yield of 4.21%. The peak-to-valley is -51.18%. The capital gains were 77.11%. The overall gain/loss (cap gains + yield) is 135.39%, or a gain/loss per month of 9.77%. The average volume since inception was 192,694.
CHPY received a recent dividend of $0.6684 on 5/28/2026. This means the current yield ($0.6684 / $80.85 * weeks/months per year paid) is 42.99%.
[2] YieldMax Target 12 Semiconductor Option Inc ETF [SOXY]
SOXY had total dividends of $9.6481 from 12/3/2024 to 5/29/2026. It has been active for 17.85 months. During that time frame it had a starting price of $50.10, a high price of $103.29, a low price of $35.02, and a 5/29/2026 price of $100.53. This means that it had a yield of 19.26%, or an average monthly yield of 1.08%. The peak-to-valley is -66.10%. The capital gains were 100.66%. The overall gain/loss (cap gains + yield) is 119.92%, or a gain/loss per month of 6.72%. The average volume since inception was 7,326.
SOXY received a recent dividend of $0.8297 on 5/7/2026. This means the current yield ($0.8297 / $100.53 * weeks/months per year paid) is 9.90%.
[3] YieldMax PLTR Option Income Strategy ETF [PLTY]
PLTY had total dividends of $73.1521 from 10/8/2024 to 5/29/2026. It has been active for 19.69 months. During that time frame it had a starting price of $51.43, a high price of $95.08, a low price of $32.30, and a 5/29/2026 price of $37.89. This means that it had a yield of 142.24%, or an average monthly yield of 7.22%. The peak-to-valley is -66.03%. The capital gains were -26.33%. The overall gain/loss (cap gains + yield) is 115.91%, or a gain/loss per month of 5.89%. The average volume since inception was 307,824.
PLTY received a recent dividend of $0.3673 on 5/29/2026. This means the current yield ($0.3673 / $37.89 * weeks/months per year paid) is 50.41%.
[4] YieldMax NVDA Option Income Strategy ETF [NVDY]
NVDY had total dividends of $39.3830 from 5/11/2023 to 5/29/2026. It has been active for 36.59 months. During that time frame it had a starting price of $19.91, a high price of $31.77, a low price of $12.34, and a 5/29/2026 price of $13.42. This means that it had a yield of 197.81%, or an average monthly yield of 5.41%. The peak-to-valley is -61.16%. The capital gains were -32.60%. The overall gain/loss (cap gains + yield) is 165.21%, or a gain/loss per month of 4.51%. The average volume since inception was 2,521,004.
NVDY received a recent dividend of $0.1247 on 5/29/2026. This means the current yield ($0.1247 / $13.42 * weeks/months per year paid) is 48.32%.
[5] YieldMax HOOD Option Income Strategy ETF [HOOY]
HOOY had total dividends of $48.8237 from 5/8/2025 to 5/29/2026. It has been active for 12.69 months. During that time frame it had a starting price of $52.82, a high price of $80.99, a low price of $25.85, and a 5/29/2026 price of $31.50. This means that it had a yield of 92.43%, or an average monthly yield of 7.28%. The peak-to-valley is -68.08%. The capital gains were -40.36%. The overall gain/loss (cap gains + yield) is 52.07%, or a gain/loss per month of 4.10%. The average volume since inception was 171,984.
HOOY received a recent dividend of $0.3389 on 5/29/2026. This means the current yield ($0.3389 / $31.50 * weeks/months per year paid) is 55.95%.
[6] YieldMax TSM Option Income Strategy ETF [TSMY]
TSMY had total dividends of $14.8158 from 8/21/2024 to 5/29/2026. It has been active for 21.26 months. During that time frame it had a starting price of $20.03, a high price of $22.31, a low price of $12.10, and a 5/29/2026 price of $16.70. This means that it had a yield of 73.97%, or an average monthly yield of 3.48%. The peak-to-valley is -45.76%. The capital gains were -16.63%. The overall gain/loss (cap gains + yield) is 57.34%, or a gain/loss per month of 2.70%. The average volume since inception was 101,481.
TSMY received a recent dividend of $0.1307 on 5/29/2026. This means the current yield ($0.1307 / $16.70 * weeks/months per year paid) is 40.70%.
[7] YieldMax NVDA Performance Distribution Target 25 ETF [NVIT]
NVIT had total dividends of $6.1483 from 11/18/2025 to 5/29/2026. It has been active for 6.36 months. During that time frame it had a starting price of $49.25, a high price of $56.26, a low price of $44.20, and a 5/29/2026 price of $51.22. This means that it had a yield of 12.48%, or an average monthly yield of 1.96%. The peak-to-valley is -21.44%. The capital gains were 4.00%. The overall gain/loss (cap gains + yield) is 16.48%, or a gain/loss per month of 2.59%. The average volume since inception was 4,369.
NVIT received a recent dividend of $0.2543 on 5/28/2026. This means the current yield ($0.2543 / $51.22 * weeks/months per year paid) is 25.82%.
[8] YieldMax AI & Tech Portfolio Option Income ETF [GPTY]
GPTY had total dividends of $20.5487 from 1/23/2025 to 5/29/2026. It has been active for 16.2 months. During that time frame it had a starting price of $50.09, a high price of $50.43, a low price of $32.92, and a 5/29/2026 price of $48.70. This means that it had a yield of 41.02%, or an average monthly yield of 2.53%. The peak-to-valley is -34.72%. The capital gains were -2.78%. The overall gain/loss (cap gains + yield) is 38.25%, or a gain/loss per month of 2.36%. The average volume since inception was 37,095.
GPTY received a recent dividend of $0.3602 on 5/28/2026. This means the current yield ($0.3602 / $48.70 * weeks/months per year paid) is 38.46%.
[9] YieldMax SNOW Option Income Strategy ETF [SNOY]
SNOY had total dividends of $18.3258 from 6/11/2024 to 5/29/2026. It has been active for 23.59 months. During that time frame it had a starting price of $20.18, a high price of $23.76, a low price of $6.17, and a 5/29/2026 price of $11.01. This means that it had a yield of 90.81%, or an average monthly yield of 3.85%. The peak-to-valley is -74.03%. The capital gains were -45.44%. The overall gain/loss (cap gains + yield) is 45.37%, or a gain/loss per month of 1.92%. The average volume since inception was 111,601.
SNOY received a recent dividend of $0.1565 on 5/29/2026. This means the current yield ($0.1565 / $11.01 * weeks/months per year paid) is 73.91%.
[10] YieldMax AMZN Option Income Strategy ETF [AMZY]
AMZY had total dividends of $20.3715 from 7/25/2023 to 5/29/2026. It has been active for 34.13 months. During that time frame it had a starting price of $20.05, a high price of $24.10, a low price of $10.61, and a 5/29/2026 price of $12.26. This means that it had a yield of 101.60%, or an average monthly yield of 2.98%. The peak-to-valley is -55.98%. The capital gains were -38.85%. The overall gain/loss (cap gains + yield) is 62.75%, or a gain/loss per month of 1.84%. The average volume since inception was 286,995.
AMZY received a recent dividend of $0.0942 on 5/29/2026. This means the current yield ($0.0942 / $12.26 * weeks/months per year paid) is 39.95%.
[11] YieldMax Magnificent 7 Fund of Option Income ETFs [YMAG]
YMAG had total dividends of $16.3189 from 1/30/2024 to 5/29/2026. It has been active for 27.95 months. During that time frame it had a starting price of $19.89, a high price of $21.91, a low price of $11.47, and a 5/29/2026 price of $12.90. This means that it had a yield of 82.05%, or an average monthly yield of 2.94%. The peak-to-valley is -47.65%. The capital gains were -35.14%. The overall gain/loss (cap gains + yield) is 46.90%, or a gain/loss per month of 1.68%. The average volume since inception was 669,892.
YMAG received a recent dividend of $0.1134 on 5/28/2026. This means the current yield ($0.1134 / $12.90 * weeks/months per year paid) is 45.71%.
[12] YieldMax Gold Miners Option Income Strategy ETF [GDXY]
GDXY had total dividends of $15.3578 from 5/21/2024 to 5/29/2026. It has been active for 24.26 months. During that time frame it had a starting price of $19.85, a high price of $19.98, a low price of $11.73, and a 5/29/2026 price of $12.25. This means that it had a yield of 77.37%, or an average monthly yield of 3.19%. The peak-to-valley is -41.29%. The capital gains were -38.29%. The overall gain/loss (cap gains + yield) is 39.08%, or a gain/loss per month of 1.61%. The average volume since inception was 368,697.
GDXY received a recent dividend of $0.1105 on 5/29/2026. This means the current yield ($0.1105 / $12.25 * weeks/months per year paid) is 46.91%.
[13] YieldMax CVNA Option Income Strategy ETF [CVNY]
CVNY had total dividends of $37.9089 from 1/30/2025 to 5/29/2026. It has been active for 15.95 months. During that time frame it had a starting price of $50.00, a high price of $58.17, a low price of $21.66, and a 5/29/2026 price of $24.58. This means that it had a yield of 75.82%, or an average monthly yield of 4.75%. The peak-to-valley is -62.76%. The capital gains were -50.84%. The overall gain/loss (cap gains + yield) is 24.98%, or a gain/loss per month of 1.57%. The average volume since inception was 59,575.
CVNY received a recent dividend of $0.2796 on 5/29/2026. This means the current yield ($0.2796 / $24.58 * weeks/months per year paid) is 59.15%.
[14] YieldMax NFLX Option Income Strategy ETF [NFLY]
NFLY had total dividends of $20.6839 from 8/8/2023 to 5/29/2026. It has been active for 33.69 months. During that time frame it had a starting price of $19.99, a high price of $20.36, a low price of $9.39, and a 5/29/2026 price of $9.41. This means that it had a yield of 103.47%, or an average monthly yield of 3.07%. The peak-to-valley is -53.88%. The capital gains were -52.93%. The overall gain/loss (cap gains + yield) is 50.54%, or a gain/loss per month of 1.50%. The average volume since inception was 126,615.
NFLY received a recent dividend of $0.0604 on 5/29/2026. This means the current yield ($0.0604 / $9.41 * weeks/months per year paid) is 33.38%.
[15] YieldMax META Option Income Strategy ETF [FBY]
FBY had total dividends of $20.9464 from 7/28/2023 to 5/29/2026. It has been active for 34.03 months. During that time frame it had a starting price of $20.63, a high price of $24.49, a low price of $9.40, and a 5/29/2026 price of $10.16. This means that it had a yield of 101.53%, or an average monthly yield of 2.98%. The peak-to-valley is -61.62%. The capital gains were -50.75%. The overall gain/loss (cap gains + yield) is 50.78%, or a gain/loss per month of 1.49%. The average volume since inception was 127,425.
FBY received a recent dividend of $0.0688 on 5/29/2026. This means the current yield ($0.0688 / $10.16 * weeks/months per year paid) is 35.21%.
[16] YieldMax GOOGL Option Income Strategy ETF [GOOY]
GOOY had total dividends of $15.6680 from 7/28/2023 to 5/29/2026. It has been active for 34.03 months. During that time frame it had a starting price of $20.50, a high price of $20.83, a low price of $10.89, and a 5/29/2026 price of $14.48. This means that it had a yield of 76.43%, or an average monthly yield of 2.25%. The peak-to-valley is -47.72%. The capital gains were -29.37%. The overall gain/loss (cap gains + yield) is 47.06%, or a gain/loss per month of 1.38%. The average volume since inception was 190,079.
GOOY received a recent dividend of $0.1507 on 5/29/2026. This means the current yield ($0.1507 / $14.48 * weeks/months per year paid) is 54.12%.
[17] YieldMax Target 12 Big 50 Option Income ETF [BIGY]
BIGY had total dividends of $8.6091 from 11/21/2024 to 5/29/2026. It has been active for 18.26 months. During that time frame it had a starting price of $50.15, a high price of $54.64, a low price of $40.00, and a 5/29/2026 price of $54.05. This means that it had a yield of 17.17%, or an average monthly yield of 0.94%. The peak-to-valley is -26.79%. The capital gains were 7.78%. The overall gain/loss (cap gains + yield) is 24.94%, or a gain/loss per month of 1.37%. The average volume since inception was 7,331.
BIGY received a recent dividend of $0.5213 on 5/7/2026. This means the current yield ($0.5213 / $54.05 * weeks/months per year paid) is 11.57%.
[18] YieldMax BABA Option Income Strategy ETF [BABO]
BABO had total dividends of $17.0450 from 8/8/2024 to 5/29/2026. It has been active for 21.69 months. During that time frame it had a starting price of $20.42, a high price of $25.53, a low price of $9.34, and a 5/29/2026 price of $9.39. This means that it had a yield of 83.47%, or an average monthly yield of 3.85%. The peak-to-valley is -63.42%. The capital gains were -54.02%. The overall gain/loss (cap gains + yield) is 29.46%, or a gain/loss per month of 1.36%. The average volume since inception was 71,614.
BABO received a recent dividend of $0.0872 on 5/29/2026. This means the current yield ($0.0872 / $9.39 * weeks/months per year paid) is 48.29%.
[19] YieldMax Russell 2000 0DTE Covered Call Strat ETF [RDTY]
RDTY had total dividends of $20.4438 from 3/6/2025 to 5/29/2026. It has been active for 14.76 months. During that time frame it had a starting price of $49.21, a high price of $50.07, a low price of $35.11, and a 5/29/2026 price of $38.10. This means that it had a yield of 41.54%, or an average monthly yield of 2.82%. The peak-to-valley is -29.88%. The capital gains were -22.58%. The overall gain/loss (cap gains + yield) is 18.97%, or a gain/loss per month of 1.29%. The average volume since inception was 11,077.
RDTY received a recent dividend of $0.2358 on 5/28/2026. This means the current yield ($0.2358 / $38.10 * weeks/months per year paid) is 32.18%.
[20] YieldMax Nasdaq 100 0DTE Covered Call Strategy ETF [QDTY]
QDTY had total dividends of $17.1839 from 2/13/2025 to 5/29/2026. It has been active for 15.53 months. During that time frame it had a starting price of $50.61, a high price of $52.55, a low price of $36.36, and a 5/29/2026 price of $43.40. This means that it had a yield of 33.95%, or an average monthly yield of 2.19%. The peak-to-valley is -30.81%. The capital gains were -14.25%. The overall gain/loss (cap gains + yield) is 19.71%, or a gain/loss per month of 1.27%. The average volume since inception was 12,169.
QDTY received a recent dividend of $0.2235 on 5/28/2026. This means the current yield ($0.2235 / $43.40 * weeks/months per year paid) is 26.78%.
[21] YieldMax TSLA Performance Distribution Target 25 ETF [TEST]
TEST had total dividends of $6.0487 from 11/18/2025 to 5/29/2026. It has been active for 6.36 months. During that time frame it had a starting price of $49.66, a high price of $57.74, a low price of $40.27, and a 5/29/2026 price of $47.24. This means that it had a yield of 12.18%, or an average monthly yield of 1.91%. The peak-to-valley is -30.26%. The capital gains were -4.87%. The overall gain/loss (cap gains + yield) is 7.31%, or a gain/loss per month of 1.15%. The average volume since inception was 1,993.
TEST received a recent dividend of $0.2228 on 5/28/2026. This means the current yield ($0.2228 / $47.24 * weeks/months per year paid) is 24.52%.
[22] YieldMax MSFT Option Income Strategy ETF [MSFO]
MSFO had total dividends of $14.9334 from 8/25/2023 to 5/29/2026. It has been active for 33.13 months. During that time frame it had a starting price of $20.18, a high price of $23.48, a low price of $11.14, and a 5/29/2026 price of $12.68. This means that it had a yield of 74.00%, or an average monthly yield of 2.23%. The peak-to-valley is -52.56%. The capital gains were -37.17%. The overall gain/loss (cap gains + yield) is 36.84%, or a gain/loss per month of 1.11%. The average volume since inception was 72,002.
MSFO received a recent dividend of $0.0816 on 5/29/2026. This means the current yield ($0.0816 / $12.68 * weeks/months per year paid) is 33.46%.
[23] YieldMax Universe Fund of Option Income ETFs [YMAX]
YMAX had total dividends of $17.0913 from 1/17/2024 to 5/29/2026. It has been active for 28.39 months. During that time frame it had a starting price of $19.90, a high price of $21.94, a low price of $7.47, and a 5/29/2026 price of $8.77. This means that it had a yield of 85.89%, or an average monthly yield of 3.02%. The peak-to-valley is -65.95%. The capital gains were -55.93%. The overall gain/loss (cap gains + yield) is 29.96%, or a gain/loss per month of 1.06%. The average volume since inception was 1,471,910.
YMAX received a recent dividend of $0.0902 on 5/28/2026. This means the current yield ($0.0902 / $8.77 * weeks/months per year paid) is 53.48%.
[24] YieldMax MSTR Short Option Income Strategy ETF [WNTR]
WNTR had total dividends of $33.6457 from 3/27/2025 to 5/29/2026. It has been active for 14.07 months. During that time frame it had a starting price of $50.06, a high price of $60.64, a low price of $20.85, and a 5/29/2026 price of $22.95. This means that it had a yield of 67.21%, or an average monthly yield of 4.78%. The peak-to-valley is -65.62%. The capital gains were -54.16%. The overall gain/loss (cap gains + yield) is 13.06%, or a gain/loss per month of 0.93%. The average volume since inception was 139,492.
WNTR received a recent dividend of $0.3100 on 5/29/2026. This means the current yield ($0.3100 / $22.95 * weeks/months per year paid) is 70.24%.
[25] YieldMax JP Option Income Strategy ETF [JPO]
JPO had total dividends of $12.6635 from 9/12/2023 to 5/29/2026. It has been active for 32.56 months. During that time frame it had a starting price of $20.06, a high price of $22.30, a low price of $13.26, and a 5/29/2026 price of $13.42. This means that it had a yield of 63.13%, or an average monthly yield of 1.94%. The peak-to-valley is -40.54%. The capital gains were -33.10%. The overall gain/loss (cap gains + yield) is 30.03%, or a gain/loss per month of 0.92%. The average volume since inception was 30,681.
JPO received a recent dividend of $0.0651 on 5/29/2026. This means the current yield ($0.0651 / $13.42 * weeks/months per year paid) is 25.23%.
[26] YieldMax S&P 500 0DTE Covered Call Strategy ETF [SDTY]
SDTY had total dividends of $14.6681 from 2/6/2025 to 5/29/2026. It has been active for 15.76 months. During that time frame it had a starting price of $50.29, a high price of $51.29, a low price of $38.59, and a 5/29/2026 price of $42.91. This means that it had a yield of 29.17%, or an average monthly yield of 1.85%. The peak-to-valley is -24.76%. The capital gains were -14.67%. The overall gain/loss (cap gains + yield) is 14.49%, or a gain/loss per month of 0.92%. The average volume since inception was 11,067.
SDTY received a recent dividend of $0.2098 on 5/28/2026. This means the current yield ($0.2098 / $42.91 * weeks/months per year paid) is 25.42%.
[27] YieldMax AAPL Option Income Strategy ETF [APLY]
APLY had total dividends of $13.6881 from 4/18/2023 to 5/29/2026. It has been active for 37.36 months. During that time frame it had a starting price of $20.20, a high price of $23.02, a low price of $11.36, and a 5/29/2026 price of $12.79. This means that it had a yield of 67.76%, or an average monthly yield of 1.81%. The peak-to-valley is -50.65%. The capital gains were -36.68%. The overall gain/loss (cap gains + yield) is 31.08%, or a gain/loss per month of 0.83%. The average volume since inception was 100,920.
APLY received a recent dividend of $0.1208 on 5/29/2026. This means the current yield ($0.1208 / $12.79 * weeks/months per year paid) is 49.11%.
[28] YieldMax Target 12 Real Estate Option Income ETF [RNTY]
RNTY had total dividends of $6.0641 from 4/17/2025 to 5/29/2026. It has been active for 13.39 months. During that time frame it had a starting price of $50.86, a high price of $53.02, a low price of $47.67, and a 5/29/2026 price of $49.96. This means that it had a yield of 11.92%, or an average monthly yield of 0.89%. The peak-to-valley is -10.09%. The capital gains were -1.77%. The overall gain/loss (cap gains + yield) is 10.15%, or a gain/loss per month of 0.76%. The average volume since inception was 6,484.
RNTY received a recent dividend of $0.5068 on 5/7/2026. This means the current yield ($0.5068 / $49.96 * weeks/months per year paid) is 12.17%.
[29] YieldMax DIS Option Income Strategy ETF [DISO]
DISO had total dividends of $13.7968 from 8/25/2023 to 5/29/2026. It has been active for 33.13 months. During that time frame it had a starting price of $20.16, a high price of $22.69, a low price of $9.53, and a 5/29/2026 price of $9.70. This means that it had a yield of 68.44%, or an average monthly yield of 2.07%. The peak-to-valley is -58.00%. The capital gains were -51.88%. The overall gain/loss (cap gains + yield) is 16.55%, or a gain/loss per month of 0.50%. The average volume since inception was 16,737.
DISO received a recent dividend of $0.0684 on 5/29/2026. This means the current yield ($0.0684 / $9.70 * weeks/months per year paid) is 36.67%.
[30] YieldMax Crypto Industry & Tech Port Opt Inc ETF [LFGY]
LFGY had total dividends of $28.7962 from 1/14/2025 to 5/29/2026. It has been active for 16.49 months. During that time frame it had a starting price of $51.25, a high price of $55.11, a low price of $18.83, and a 5/29/2026 price of $24.75. This means that it had a yield of 56.19%, or an average monthly yield of 3.41%. The peak-to-valley is -65.83%. The capital gains were -51.71%. The overall gain/loss (cap gains + yield) is 4.48%, or a gain/loss per month of 0.27%. The average volume since inception was 126,984.
LFGY received a recent dividend of $0.2535 on 5/28/2026. This means the current yield ($0.2535 / $24.75 * weeks/months per year paid) is 53.26%.
[31] YieldMax XOM Option Income Strategy ETF [XOMO]
XOMO had total dividends of $10.5490 from 8/31/2023 to 5/29/2026. It has been active for 32.92 months. During that time frame it had a starting price of $20.00, a high price of $23.38, a low price of $11.19, and a 5/29/2026 price of $11.21. This means that it had a yield of 52.75%, or an average monthly yield of 1.60%. The peak-to-valley is -52.14%. The capital gains were -43.95%. The overall gain/loss (cap gains + yield) is 8.80%, or a gain/loss per month of 0.27%. The average volume since inception was 57,133.
XOMO received a recent dividend of $0.0788 on 5/29/2026. This means the current yield ($0.0788 / $11.21 * weeks/months per year paid) is 36.55%.
[32] YieldMax BRK B Option Income Strategy ETF [BRKC]
BRKC had total dividends of $8.1345 from 6/5/2025 to 5/29/2026. It has been active for 11.79 months. During that time frame it had a starting price of $49.68, a high price of $50.66, a low price of $40.24, and a 5/29/2026 price of $40.25. This means that it had a yield of 16.37%, or an average monthly yield of 1.39%. The peak-to-valley is -20.57%. The capital gains were -18.98%. The overall gain/loss (cap gains + yield) is -2.61%, or a gain/loss per month of -0.22%. The average volume since inception was 14,419.
BRKC received a recent dividend of $0.1826 on 5/29/2026. This means the current yield ($0.1826 / $40.25 * weeks/months per year paid) is 23.59%.
[33] YieldMax Dorsey Wright Hybrid 5 Income ETF [FIVY]
FIVY had total dividends of $17.9189 from 12/17/2024 to 5/29/2026. It has been active for 17.39 months. During that time frame it had a starting price of $49.78, a high price of $52.51, a low price of $22.23, and a 5/29/2026 price of $25.48. This means that it had a yield of 36.00%, or an average monthly yield of 2.07%. The peak-to-valley is -57.67%. The capital gains were -48.81%. The overall gain/loss (cap gains + yield) is -12.82%, or a gain/loss per month of -0.74%. The average volume since inception was 8,942.
FIVY received a recent dividend of $0.1537 on 5/28/2026. This means the current yield ($0.1537 / $25.48 * weeks/months per year paid) is 31.37%.
[34] YieldMax Short N100 Option Income Strategy ETF [YQQQ]
YQQQ had total dividends of $6.5000 from 8/15/2024 to 5/29/2026. It has been active for 21.46 months. During that time frame it had a starting price of $19.64, a high price of $20.55, a low price of $9.94, and a 5/29/2026 price of $9.98. This means that it had a yield of 33.10%, or an average monthly yield of 1.54%. The peak-to-valley is -51.63%. The capital gains were -49.19%. The overall gain/loss (cap gains + yield) is -16.09%, or a gain/loss per month of -0.75%. The average volume since inception was 44,610.
YQQQ received a recent dividend of $0.0439 on 5/29/2026. This means the current yield ($0.0439 / $9.98 * weeks/months per year paid) is 22.87%.
[35] YieldMax Dorsey Wright Featured 5 Income ETF [FEAT]
FEAT had total dividends of $23.9687 from 12/17/2024 to 5/29/2026. It has been active for 17.39 months. During that time frame it had a starting price of $49.71, a high price of $50.21, a low price of $17.30, and a 5/29/2026 price of $18.81. This means that it had a yield of 48.22%, or an average monthly yield of 2.77%. The peak-to-valley is -65.54%. The capital gains were -62.16%. The overall gain/loss (cap gains + yield) is -13.94%, or a gain/loss per month of -0.80%. The average volume since inception was 23,468.
FEAT received a recent dividend of $0.2153 on 5/28/2026. This means the current yield ($0.2153 / $18.81 * weeks/months per year paid) is 59.52%.
[36] YieldMax SMCI Option Income Strategy ETF [SMCY]
SMCY had total dividends of $30.9814 from 9/12/2024 to 5/29/2026. It has been active for 20.56 months. During that time frame it had a starting price of $50.62, a high price of $59.20, a low price of $4.80, and a 5/29/2026 price of $8.00. This means that it had a yield of 61.20%, or an average monthly yield of 2.98%. The peak-to-valley is -91.89%. The capital gains were -84.20%. The overall gain/loss (cap gains + yield) is -22.99%, or a gain/loss per month of -1.12%. The average volume since inception was 792,923.
SMCY received a recent dividend of $0.1388 on 5/29/2026. This means the current yield ($0.1388 / $8.00 * weeks/months per year paid) is 90.22%.
[37] YieldMax GME Option Income Strategy ETF [GMEY]
GMEY had total dividends of $14.8483 from 9/9/2025 to 5/29/2026. It has been active for 8.66 months. During that time frame it had a starting price of $50.43, a high price of $56.15, a low price of $28.59, and a 5/29/2026 price of $28.59. This means that it had a yield of 29.44%, or an average monthly yield of 3.40%. The peak-to-valley is -49.08%. The capital gains were -43.31%. The overall gain/loss (cap gains + yield) is -13.86%, or a gain/loss per month of -1.60%. The average volume since inception was 9,740.
GMEY received a recent dividend of $0.3192 on 5/29/2026. This means the current yield ($0.3192 / $28.59 * weeks/months per year paid) is 58.06%.
[38] YieldMax Ultra Short Option Income Strategy ETF [SLTY]
SLTY had total dividends of $17.6317 from 8/21/2025 to 5/29/2026. It has been active for 9.26 months. During that time frame it had a starting price of $49.96, a high price of $50.47, a low price of $24.20, and a 5/29/2026 price of $24.27. This means that it had a yield of 35.29%, or an average monthly yield of 3.81%. The peak-to-valley is -52.05%. The capital gains were -51.42%. The overall gain/loss (cap gains + yield) is -16.13%, or a gain/loss per month of -1.74%. The average volume since inception was 40,510.
SLTY received a recent dividend of $0.3159 on 5/28/2026. This means the current yield ($0.3159 / $24.27 * weeks/months per year paid) is 67.68%.
[39] YieldMax MARA Option Income Strategy ETF [MARO]
MARO had total dividends of $23.6310 from 12/10/2024 to 5/29/2026. It has been active for 17.62 months. During that time frame it had a starting price of $47.14, a high price of $53.06, a low price of $5.04, and a 5/29/2026 price of $6.76. This means that it had a yield of 50.13%, or an average monthly yield of 2.84%. The peak-to-valley is -90.50%. The capital gains were -85.66%. The overall gain/loss (cap gains + yield) is -35.53%, or a gain/loss per month of -2.02%. The average volume since inception was 211,800.
MARO received a recent dividend of $0.1186 on 5/29/2026. This means the current yield ($0.1186 / $6.76 * weeks/months per year paid) is 91.23%.
[40] YieldMax Strat Metals & Mining Portfolio Opt Inc [MINY]
MINY had total dividends of $3.2582 from 2/27/2026 to 5/29/2026. It has been active for 3.07 months. During that time frame it had a starting price of $50.29, a high price of $51.40, a low price of $38.67, and a 5/29/2026 price of $43.91. This means that it had a yield of 6.48%, or an average monthly yield of 2.11%. The peak-to-valley is -24.77%. The capital gains were -12.69%. The overall gain/loss (cap gains + yield) is -6.21%, or a gain/loss per month of -2.02%. The average volume since inception was 6,847.
MINY received a recent dividend of $0.2473 on 5/28/2026. This means the current yield ($0.2473 / $43.91 * weeks/months per year paid) is 29.29%.
[41] YieldMax CRCL Option Income Strategy ETF [CRCO]
CRCO had total dividends of $17.2096 from 9/30/2025 to 5/29/2026. It has been active for 7.95 months. During that time frame it had a starting price of $49.21, a high price of $57.31, a low price of $15.01, and a 5/29/2026 price of $23.11. This means that it had a yield of 34.97%, or an average monthly yield of 4.40%. The peak-to-valley is -73.81%. The capital gains were -53.04%. The overall gain/loss (cap gains + yield) is -18.07%, or a gain/loss per month of -2.27%. The average volume since inception was 66,882.
CRCO received a recent dividend of $0.4249 on 5/29/2026. This means the current yield ($0.4249 / $23.11 * weeks/months per year paid) is 95.61%.
[42] YieldMax RDDT Option Income Strategy ETF [RDYY]
RDYY had total dividends of $17.4764 from 9/9/2025 to 5/29/2026. It has been active for 8.66 months. During that time frame it had a starting price of $51.29, a high price of $56.57, a low price of $17.99, and a 5/29/2026 price of $21.66. This means that it had a yield of 34.07%, or an average monthly yield of 3.94%. The peak-to-valley is -68.20%. The capital gains were -57.77%. The overall gain/loss (cap gains + yield) is -23.70%, or a gain/loss per month of -2.74%. The average volume since inception was 35,534.
RDYY received a recent dividend of $0.2713 on 5/29/2026. This means the current yield ($0.2713 / $21.66 * weeks/months per year paid) is 65.13%.
[43] YieldMax MSTR Performance & Distribution Tg 25 ETF [MSST]
MSST had total dividends of $4.9362 from 11/18/2025 to 5/29/2026. It has been active for 6.36 months. During that time frame it had a starting price of $53.14, a high price of $54.29, a low price of $28.30, and a 5/29/2026 price of $37.57. This means that it had a yield of 9.29%, or an average monthly yield of 1.46%. The peak-to-valley is -47.87%. The capital gains were -29.30%. The overall gain/loss (cap gains + yield) is -20.01%, or a gain/loss per month of -3.15%. The average volume since inception was 2,596.
MSST received a recent dividend of $0.1819 on 5/28/2026. This means the current yield ($0.1819 / $37.57 * weeks/months per year paid) is 25.18%.
[44] YieldMax DKNG Option Income Strategy ETF [DRAY]
DRAY had total dividends of $15.1152 from 7/15/2025 to 5/29/2026. It has been active for 10.46 months. During that time frame it had a starting price of $50.09, a high price of $53.95, a low price of $15.00, and a 5/29/2026 price of $16.99. This means that it had a yield of 30.18%, or an average monthly yield of 2.88%. The peak-to-valley is -72.20%. The capital gains were -66.08%. The overall gain/loss (cap gains + yield) is -35.90%, or a gain/loss per month of -3.43%. The average volume since inception was 15,475.
DRAY received a recent dividend of $0.3210 on 5/29/2026. This means the current yield ($0.3210 / $16.99 * weeks/months per year paid) is 98.25%.
[45] YieldMax RBLX Option Income Strategy ETF [RBLY]
RBLY had total dividends of $15.7675 from 7/29/2025 to 5/29/2026. It has been active for 10 months. During that time frame it had a starting price of $49.34, a high price of $58.42, a low price of $12.50, and a 5/29/2026 price of $13.18. This means that it had a yield of 31.96%, or an average monthly yield of 3.20%. The peak-to-valley is -78.60%. The capital gains were -73.29%. The overall gain/loss (cap gains + yield) is -41.33%, or a gain/loss per month of -4.13%. The average volume since inception was 18,066.
RBLY received a recent dividend of $0.1898 on 5/29/2026. This means the current yield ($0.1898 / $13.18 * weeks/months per year paid) is 74.88%.
[46] YieldMax HIMS Option Income Strategy ETF [HIYY]
HIYY had total dividends of $13.0159 from 9/23/2025 to 5/29/2026. It has been active for 8.2 months. During that time frame it had a starting price of $48.32, a high price of $53.97, a low price of $9.53, and a 5/29/2026 price of $14.33. This means that it had a yield of 26.94%, or an average monthly yield of 3.29%. The peak-to-valley is -82.34%. The capital gains were -70.34%. The overall gain/loss (cap gains + yield) is -43.41%, or a gain/loss per month of -5.30%. The average volume since inception was 48,398.
HIYY received a recent dividend of $0.2387 on 5/29/2026. This means the current yield ($0.2387 / $14.33 * weeks/months per year paid) is 86.62%.