
YIELDMAX -- Yield + Capital Gain Analysis 8/14/2026
A more realistic view of current yield trends

As always, please read our disclaimer. Important!
YieldMax’s Reverse Splits
Last year YieldMax executed reverse splits across 15 of its products. We covered that split in detail here.
It is our policy is not to cover covered-call ETFs that have had reverse splits (because if it got that bad, it probably won’t get better).
If you don’t see a favorite YieldMax ticker in the analysis below, that’s why.
The Current Yield Conundrum
Covered-call ETFs are marketed on income from option premiums.
However, in practice, many also lean heavily on Return of Capital (ROC) — meaning part of the “distribution” is simply your own money being handed back to you to inflate the headline yield.
The dynamic is similar to a reverse mortgage: you receive steady payments while the underlying asset quietly deteriorates. But with a reverse mortgage, everyone knows the bank eventually owns the house.
With covered-call ETFs + ROC, many investors don’t realize the same logic can apply — NAV (Net Asset Value) can erode as fast as, or faster than, the payouts. The result: eye-popping distributions and still a negative total return.
A post worth reading before diving into the data:

About This Analysis
We evaluate all YieldMax products on Yield + Capital Gain — a more honest metric than current yield alone.
Almost all YieldMax funds have moved to weekly payouts. The exceptions — BIGY, RNTY, and SOXY — remain monthly payers. DDDD, a new product, pays quarterly.
For the broader weekly-payer universe check out this recent post:

Analysis Tables
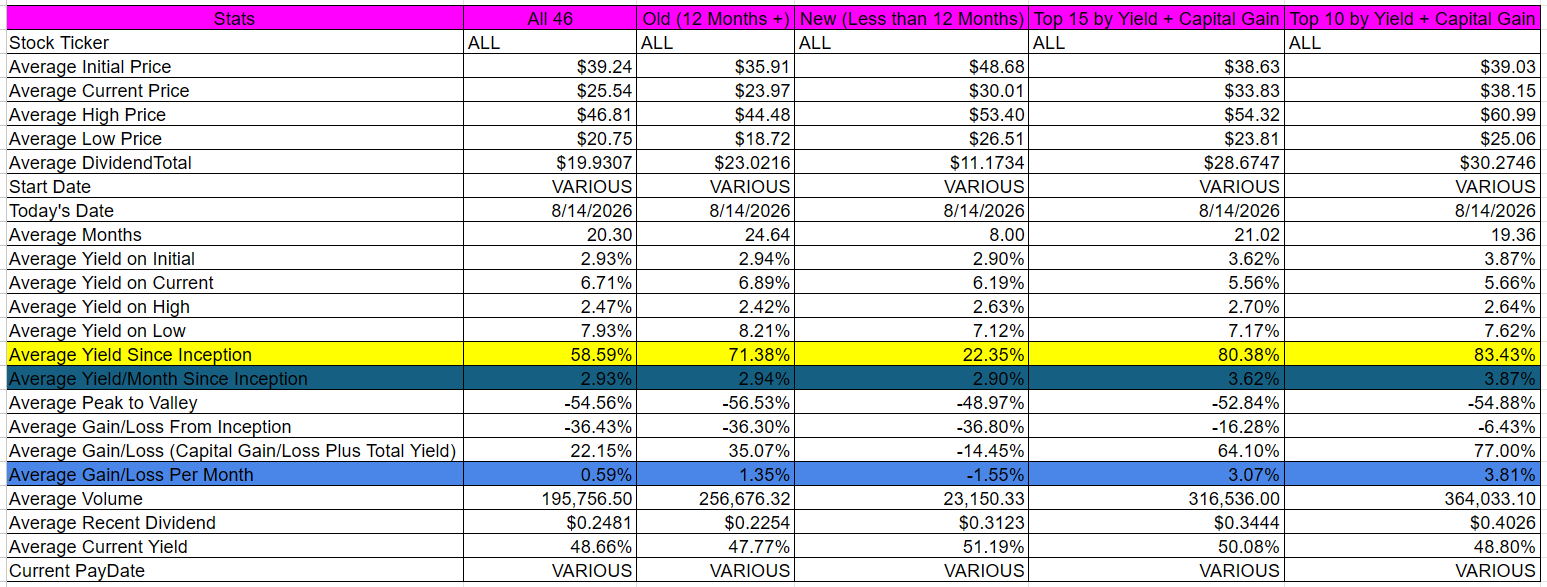
The following averages table analyzes Yield Max products across five slices — all 46 products, those with more than 12 months of history, those with less, the Top 15 by yield + capital gain, and the Top 10 by yield + capital gain:
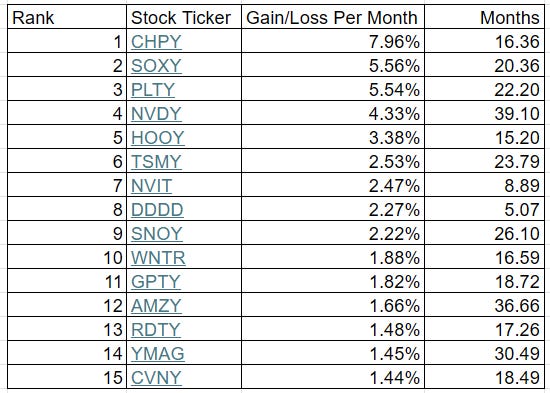
And then here is a table of the Top 15 by yield + capital gain, normalized by months in existence:
Methodology note:
Figures are (total yield + total capital gain) ÷ months since inception — not current yield
All data is calculated since inception
Dividends use the Ex-EFF Date
Support the Work
This is a free post; a paid subscription ($10/month or $100/year) goes directly toward keeping this analysis running.
One of the advantages of a paid subscription is access to our four annual Quarterly Runs.
The July Run 2026 just wrapped — a good moment to jump in if you’ve been on the fence about getting a paid subscription.
The index below provides links to the 26 sector posts in the July Run — 589 dividend stocks covered.

Individual Stock Analysis (44 entries)
Sorted by descending yield + capital gain — normalized by month
Current yield is listed but not prioritized (2nd paragraph of each entry).
Occasionally we may hold positions in some of these stocks.
[1] YieldMax Semiconductor Portfolio Option Income ETF [CHPY]
CHPY had total dividends of $33.5208 from 4/3/2025 to 8/14/2026. It has been active for 16.36 months. During that time frame it had a starting price of $45.65, a high price of $89.86, a low price of $40.40, and a 8/14/2026 price of $71.56. This means that it had a yield of 73.43%, or an average monthly yield of 4.49%. The peak-to-valley is -55.04%. The capital gains were 56.76%. The overall gain/loss (cap gains + yield) is 130.19%, or a gain/loss per month of 7.96%. The average volume since inception was 280,876.
CHPY received a recent dividend of $0.5472 on 8/13/2026. This means the current yield ($0.5472 / $71.56 * weeks/months per year paid) is 39.76%.
[2] YieldMax Target 12 Semiconductor Option Inc ETF [SOXY]
SOXY had total dividends of $12.5974 from 12/3/2024 to 8/14/2026. It has been active for 20.36 months. During that time frame it had a starting price of $50.10, a high price of $115.36, a low price of $35.02, and a 8/14/2026 price of $94.27. This means that it had a yield of 25.14%, or an average monthly yield of 1.23%. The peak-to-valley is -69.64%. The capital gains were 88.16%. The overall gain/loss (cap gains + yield) is 113.31%, or a gain/loss per month of 5.56%. The average volume since inception was 8,993.
SOXY received a recent dividend of $0.8913 on 8/6/2026. This means the current yield ($0.8913 / $94.27 * weeks/months per year paid) is 11.35%.
[3] YieldMax PLTR Option Income Strategy ETF [PLTY]
PLTY had total dividends of $77.0468 from 10/8/2024 to 8/14/2026. It has been active for 22.2 months. During that time frame it had a starting price of $51.43, a high price of $95.08, a low price of $26.06, and a 8/14/2026 price of $37.62. This means that it had a yield of 149.81%, or an average monthly yield of 6.75%. The peak-to-valley is -72.59%. The capital gains were -26.85%. The overall gain/loss (cap gains + yield) is 122.96%, or a gain/loss per month of 5.54%. The average volume since inception was 292,655.
PLTY received a recent dividend of $0.7460 on 8/14/2026. This means the current yield ($0.7460 / $37.62 * weeks/months per year paid) is 103.12%.
[4] YieldMax NVDA Option Income Strategy ETF [NVDY]
NVDY had total dividends of $40.5558 from 5/11/2023 to 8/14/2026. It has been active for 39.1 months. During that time frame it had a starting price of $19.91, a high price of $31.77, a low price of $11.57, and a 8/14/2026 price of $13.09. This means that it had a yield of 203.70%, or an average monthly yield of 5.21%. The peak-to-valley is -63.58%. The capital gains were -34.25%. The overall gain/loss (cap gains + yield) is 169.44%, or a gain/loss per month of 4.33%. The average volume since inception was 2,515,601.
NVDY received a recent dividend of $0.0988 on 8/14/2026. This means the current yield ($0.0988 / $13.09 * weeks/months per year paid) is 39.25%.
[5] YieldMax HOOD Option Income Strategy ETF [HOOY]
HOOY had total dividends of $54.0616 from 5/8/2025 to 8/14/2026. It has been active for 15.2 months. During that time frame it had a starting price of $52.82, a high price of $80.99, a low price of $23.85, and a 8/14/2026 price of $25.86. This means that it had a yield of 102.35%, or an average monthly yield of 6.73%. The peak-to-valley is -70.55%. The capital gains were -51.04%. The overall gain/loss (cap gains + yield) is 51.31%, or a gain/loss per month of 3.38%. The average volume since inception was 165,152.
HOOY received a recent dividend of $0.3107 on 8/14/2026. This means the current yield ($0.3107 / $25.86 * weeks/months per year paid) is 62.48%.
[6] YieldMax TSM Option Income Strategy ETF [TSMY]
TSMY had total dividends of $16.4247 from 8/21/2024 to 8/14/2026. It has been active for 23.79 months. During that time frame it had a starting price of $20.03, a high price of $22.31, a low price of $12.10, and a 8/14/2026 price of $15.65. This means that it had a yield of 82.00%, or an average monthly yield of 3.45%. The peak-to-valley is -45.76%. The capital gains were -21.87%. The overall gain/loss (cap gains + yield) is 60.13%, or a gain/loss per month of 2.53%. The average volume since inception was 109,471.
TSMY received a recent dividend of $0.1197 on 8/14/2026. This means the current yield ($0.1197 / $15.65 * weeks/months per year paid) is 39.77%.
[7] YieldMax NVDA Performance Distribution Target 25 ETF [NVIT]
NVIT had total dividends of $8.7645 from 11/18/2025 to 8/14/2026. It has been active for 8.89 months. During that time frame it had a starting price of $49.25, a high price of $56.26, a low price of $44.20, and a 8/14/2026 price of $51.29. This means that it had a yield of 17.80%, or an average monthly yield of 2.00%. The peak-to-valley is -21.44%. The capital gains were 4.14%. The overall gain/loss (cap gains + yield) is 21.94%, or a gain/loss per month of 2.47%. The average volume since inception was 5,043.
NVIT received a recent dividend of $0.2479 on 8/12/2026. This means the current yield ($0.2479 / $51.29 * weeks/months per year paid) is 25.13%.
[8] YieldMax US Stocks Target Double Distribution ETF [DDDD]
DDDD had total dividends of $0.5050 from 3/12/2026 to 8/14/2026. It has been active for 5.07 months. During that time frame it had a starting price of $30.82, a high price of $33.90, a low price of $30.33, and a 8/14/2026 price of $33.86. This means that it had a yield of 1.64%, or an average monthly yield of 0.32%. The peak-to-valley is -10.53%. The capital gains were 9.86%. The overall gain/loss (cap gains + yield) is 11.50%, or a gain/loss per month of 2.27%. The average volume since inception was 5,893.
DDDD received a recent dividend of $0.5050 on 7/6/2026. This means the current yield ($0.5050 / $33.86 * weeks/months per year paid) is 5.97%.
[9] YieldMax SNOW Option Income Strategy ETF [SNOY]
SNOY had total dividends of $20.3114 from 6/11/2024 to 8/14/2026. It has been active for 26.1 months. During that time frame it had a starting price of $20.18, a high price of $23.76, a low price of $6.17, and a 8/14/2026 price of $11.58. This means that it had a yield of 100.65%, or an average monthly yield of 3.86%. The peak-to-valley is -74.03%. The capital gains were -42.62%. The overall gain/loss (cap gains + yield) is 58.03%, or a gain/loss per month of 2.22%. The average volume since inception was 114,230.
SNOY received a recent dividend of $0.2058 on 8/14/2026. This means the current yield ($0.2058 / $11.58 * weeks/months per year paid) is 92.41%.
[10] YieldMax MSTR Short Option Income Strategy ETF [WNTR]
WNTR had total dividends of $38.9581 from 3/27/2025 to 8/14/2026. It has been active for 16.59 months. During that time frame it had a starting price of $50.06, a high price of $60.64, a low price of $20.85, and a 8/14/2026 price of $26.72. This means that it had a yield of 77.82%, or an average monthly yield of 4.69%. The peak-to-valley is -65.62%. The capital gains were -46.62%. The overall gain/loss (cap gains + yield) is 31.20%, or a gain/loss per month of 1.88%. The average volume since inception was 142,417.
WNTR received a recent dividend of $0.3535 on 8/14/2026. This means the current yield ($0.3535 / $26.72 * weeks/months per year paid) is 68.79%.
[11] YieldMax AI & Tech Portfolio Option Income ETF [GPTY]
GPTY had total dividends of $24.0837 from 1/23/2025 to 8/14/2026. It has been active for 18.72 months. During that time frame it had a starting price of $50.09, a high price of $50.64, a low price of $32.92, and a 8/14/2026 price of $43.12. This means that it had a yield of 48.08%, or an average monthly yield of 2.57%. The peak-to-valley is -34.99%. The capital gains were -13.91%. The overall gain/loss (cap gains + yield) is 34.17%, or a gain/loss per month of 1.82%. The average volume since inception was 39,539.
GPTY received a recent dividend of $0.2933 on 8/13/2026. This means the current yield ($0.2933 / $43.12 * weeks/months per year paid) is 35.37%.
[12] YieldMax AMZN Option Income Strategy ETF [AMZY]
AMZY had total dividends of $21.2650 from 7/25/2023 to 8/14/2026. It has been active for 36.66 months. During that time frame it had a starting price of $20.05, a high price of $24.10, a low price of $9.94, and a 8/14/2026 price of $10.96. This means that it had a yield of 106.06%, or an average monthly yield of 2.89%. The peak-to-valley is -58.76%. The capital gains were -45.34%. The overall gain/loss (cap gains + yield) is 60.72%, or a gain/loss per month of 1.66%. The average volume since inception was 291,588.
AMZY received a recent dividend of $0.1340 on 8/14/2026. This means the current yield ($0.1340 / $10.96 * weeks/months per year paid) is 63.58%.
[13] YieldMax Russell 2000 0DTE Covered Call Strat ETF [RDTY]
RDTY had total dividends of $23.4987 from 3/6/2025 to 8/14/2026. It has been active for 17.26 months. During that time frame it had a starting price of $49.21, a high price of $50.07, a low price of $35.11, and a 8/14/2026 price of $38.28. This means that it had a yield of 47.75%, or an average monthly yield of 2.77%. The peak-to-valley is -29.88%. The capital gains were -22.21%. The overall gain/loss (cap gains + yield) is 25.54%, or a gain/loss per month of 1.48%. The average volume since inception was 11,354.
RDTY received a recent dividend of $0.2841 on 8/13/2026. This means the current yield ($0.2841 / $38.28 * weeks/months per year paid) is 38.59%.
[14] YieldMax Magnificent 7 Fund of Option Income ETFs [YMAG]
YMAG had total dividends of $17.3092 from 1/30/2024 to 8/14/2026. It has been active for 30.49 months. During that time frame it had a starting price of $19.89, a high price of $21.91, a low price of $10.73, and a 8/14/2026 price of $11.40. This means that it had a yield of 87.02%, or an average monthly yield of 2.85%. The peak-to-valley is -51.03%. The capital gains were -42.68%. The overall gain/loss (cap gains + yield) is 44.34%, or a gain/loss per month of 1.45%. The average volume since inception was 710,818.
YMAG received a recent dividend of $0.1120 on 8/13/2026. This means the current yield ($0.1120 / $11.40 * weeks/months per year paid) is 51.09%.
[15] YieldMax CVNA Option Income Strategy ETF [CVNY]
CVNY had total dividends of $41.2174 from 1/30/2025 to 8/14/2026. It has been active for 18.49 months. During that time frame it had a starting price of $50.00, a high price of $58.17, a low price of $17.96, and a 8/14/2026 price of $22.12. This means that it had a yield of 82.43%, or an average monthly yield of 4.46%. The peak-to-valley is -69.12%. The capital gains were -55.76%. The overall gain/loss (cap gains + yield) is 26.67%, or a gain/loss per month of 1.44%. The average volume since inception was 54,410.
CVNY received a recent dividend of $0.3171 on 8/14/2026. This means the current yield ($0.3171 / $22.12 * weeks/months per year paid) is 74.54%.
[16] YieldMax Gold Miners Option Income Strategy ETF [GDXY]
GDXY had total dividends of $16.3942 from 5/21/2024 to 8/14/2026. It has been active for 26.79 months. During that time frame it had a starting price of $19.85, a high price of $19.98, a low price of $9.27, and a 8/14/2026 price of $10.93. This means that it had a yield of 82.59%, or an average monthly yield of 3.08%. The peak-to-valley is -53.60%. The capital gains were -44.94%. The overall gain/loss (cap gains + yield) is 37.65%, or a gain/loss per month of 1.41%. The average volume since inception was 391,720.
GDXY received a recent dividend of $0.1493 on 8/14/2026. This means the current yield ($0.1493 / $10.93 * weeks/months per year paid) is 71.03%.
[17] YieldMax META Option Income Strategy ETF [FBY]
FBY had total dividends of $21.7857 from 7/28/2023 to 8/14/2026. It has been active for 36.56 months. During that time frame it had a starting price of $20.63, a high price of $24.49, a low price of $7.99, and a 8/14/2026 price of $8.66. This means that it had a yield of 105.60%, or an average monthly yield of 2.89%. The peak-to-valley is -67.37%. The capital gains were -58.02%. The overall gain/loss (cap gains + yield) is 47.58%, or a gain/loss per month of 1.30%. The average volume since inception was 129,804.
FBY received a recent dividend of $0.0659 on 8/14/2026. This means the current yield ($0.0659 / $8.66 * weeks/months per year paid) is 39.57%.
[18] YieldMax NFLX Option Income Strategy ETF [NFLY]
NFLY had total dividends of $21.2527 from 8/8/2023 to 8/14/2026. It has been active for 36.2 months. During that time frame it had a starting price of $19.99, a high price of $20.36, a low price of $7.00, and a 8/14/2026 price of $7.76. This means that it had a yield of 106.32%, or an average monthly yield of 2.94%. The peak-to-valley is -65.62%. The capital gains were -61.18%. The overall gain/loss (cap gains + yield) is 45.14%, or a gain/loss per month of 1.25%. The average volume since inception was 122,873.
NFLY received a recent dividend of $0.0530 on 8/14/2026. This means the current yield ($0.0530 / $7.76 * weeks/months per year paid) is 35.52%.
[19] YieldMax Target 12 Big 50 Option Income ETF [BIGY]
BIGY had total dividends of $10.2015 from 11/21/2024 to 8/14/2026. It has been active for 20.79 months. During that time frame it had a starting price of $50.15, a high price of $54.64, a low price of $40.00, and a 8/14/2026 price of $52.73. This means that it had a yield of 20.34%, or an average monthly yield of 0.98%. The peak-to-valley is -26.79%. The capital gains were 5.14%. The overall gain/loss (cap gains + yield) is 25.49%, or a gain/loss per month of 1.23%. The average volume since inception was 7,604.
BIGY received a recent dividend of $0.5237 on 8/6/2026. This means the current yield ($0.5237 / $52.73 * weeks/months per year paid) is 11.92%.
[20] YieldMax BABA Option Income Strategy ETF [BABO]
BABO had total dividends of $18.0088 from 8/8/2024 to 8/14/2026. It has been active for 24.2 months. During that time frame it had a starting price of $20.42, a high price of $25.53, a low price of $7.00, and a 8/14/2026 price of $8.31. This means that it had a yield of 88.19%, or an average monthly yield of 3.64%. The peak-to-valley is -72.58%. The capital gains were -59.30%. The overall gain/loss (cap gains + yield) is 28.89%, or a gain/loss per month of 1.19%. The average volume since inception was 68,395.
BABO received a recent dividend of $0.0999 on 8/14/2026. This means the current yield ($0.0999 / $8.31 * weeks/months per year paid) is 62.51%.
[21] YieldMax JP Option Income Strategy ETF [JPO]
JPO had total dividends of $13.6289 from 9/12/2023 to 8/14/2026. It has been active for 35.07 months. During that time frame it had a starting price of $20.05, a high price of $22.30, a low price of $13.26, and a 8/14/2026 price of $14.67. This means that it had a yield of 67.97%, or an average monthly yield of 1.94%. The peak-to-valley is -40.54%. The capital gains were -26.83%. The overall gain/loss (cap gains + yield) is 41.14%, or a gain/loss per month of 1.17%. The average volume since inception was 30,382.
JPO received a recent dividend of $0.0879 on 8/14/2026. This means the current yield ($0.0879 / $14.67 * weeks/months per year paid) is 31.16%.
[22] YieldMax MSFT Option Income Strategy ETF [MSFO]
MSFO had total dividends of $15.9688 from 8/25/2023 to 8/14/2026. It has been active for 35.66 months. During that time frame it had a starting price of $20.18, a high price of $23.48, a low price of $9.89, and a 8/14/2026 price of $12.51. This means that it had a yield of 79.13%, or an average monthly yield of 2.22%. The peak-to-valley is -57.88%. The capital gains were -38.01%. The overall gain/loss (cap gains + yield) is 41.12%, or a gain/loss per month of 1.15%. The average volume since inception was 73,542.
MSFO received a recent dividend of $0.2244 on 8/14/2026. This means the current yield ($0.2244 / $12.51 * weeks/months per year paid) is 93.28%.
[23] YieldMax GOOGL Option Income Strategy ETF [GOOY]
GOOY had total dividends of $16.5510 from 7/28/2023 to 8/14/2026. It has been active for 36.56 months. During that time frame it had a starting price of $20.50, a high price of $20.83, a low price of $10.89, and a 8/14/2026 price of $12.34. This means that it had a yield of 80.74%, or an average monthly yield of 2.21%. The peak-to-valley is -47.72%. The capital gains were -39.80%. The overall gain/loss (cap gains + yield) is 40.93%, or a gain/loss per month of 1.12%. The average volume since inception was 209,027.
GOOY received a recent dividend of $0.0715 on 8/14/2026. This means the current yield ($0.0715 / $12.34 * weeks/months per year paid) is 30.13%.
[24] YieldMax Nasdaq 100 0DTE Covered Call Strategy ETF [QDTY]
QDTY had total dividends of $20.2073 from 2/13/2025 to 8/14/2026. It has been active for 18.03 months. During that time frame it had a starting price of $50.61, a high price of $52.55, a low price of $36.36, and a 8/14/2026 price of $39.82. This means that it had a yield of 39.93%, or an average monthly yield of 2.21%. The peak-to-valley is -30.81%. The capital gains were -21.32%. The overall gain/loss (cap gains + yield) is 18.61%, or a gain/loss per month of 1.03%. The average volume since inception was 13,370.
QDTY received a recent dividend of $0.3028 on 8/13/2026. This means the current yield ($0.3028 / $39.82 * weeks/months per year paid) is 39.54%.
[25] YieldMax S&P 500 0DTE Covered Call Strategy ETF [SDTY]
SDTY had total dividends of $16.9708 from 2/6/2025 to 8/14/2026. It has been active for 18.26 months. During that time frame it had a starting price of $50.29, a high price of $51.29, a low price of $38.59, and a 8/14/2026 price of $41.82. This means that it had a yield of 33.75%, or an average monthly yield of 1.85%. The peak-to-valley is -24.76%. The capital gains were -16.84%. The overall gain/loss (cap gains + yield) is 16.90%, or a gain/loss per month of 0.93%. The average volume since inception was 11,649.
SDTY received a recent dividend of $0.2108 on 8/13/2026. This means the current yield ($0.2108 / $41.82 * weeks/months per year paid) is 26.21%.
[26] YieldMax Universe Fund of Option Income ETFs [YMAX]
YMAX had total dividends of $17.8784 from 1/17/2024 to 8/14/2026. It has been active for 30.92 months. During that time frame it had a starting price of $19.90, a high price of $21.94, a low price of $7.25, and a 8/14/2026 price of $7.68. This means that it had a yield of 89.84%, or an average monthly yield of 2.91%. The peak-to-valley is -66.96%. The capital gains were -61.41%. The overall gain/loss (cap gains + yield) is 28.43%, or a gain/loss per month of 0.92%. The average volume since inception was 1,483,116.
YMAX received a recent dividend of $0.0608 on 8/13/2026. This means the current yield ($0.0608 / $7.68 * weeks/months per year paid) is 41.17%.
[27] YieldMax Target 12 Real Estate Option Income ETF [RNTY]
RNTY had total dividends of $7.5686 from 4/17/2025 to 8/14/2026. It has been active for 15.92 months. During that time frame it had a starting price of $50.86, a high price of $53.02, a low price of $47.67, and a 8/14/2026 price of $49.90. This means that it had a yield of 14.88%, or an average monthly yield of 0.93%. The peak-to-valley is -10.09%. The capital gains were -1.89%. The overall gain/loss (cap gains + yield) is 12.99%, or a gain/loss per month of 0.82%. The average volume since inception was 5,856.
RNTY received a recent dividend of $0.5025 on 8/6/2026. This means the current yield ($0.5025 / $49.90 * weeks/months per year paid) is 12.08%.
[28] YieldMax AAPL Option Income Strategy ETF [APLY]
APLY had total dividends of $14.5166 from 4/18/2023 to 8/14/2026. It has been active for 39.89 months. During that time frame it had a starting price of $20.20, a high price of $23.02, a low price of $11.05, and a 8/14/2026 price of $11.42. This means that it had a yield of 71.86%, or an average monthly yield of 1.80%. The peak-to-valley is -52.00%. The capital gains were -43.47%. The overall gain/loss (cap gains + yield) is 28.40%, or a gain/loss per month of 0.71%. The average volume since inception was 102,785.
APLY received a recent dividend of $0.0560 on 8/14/2026. This means the current yield ($0.0560 / $11.42 * weeks/months per year paid) is 25.50%.
[29] YieldMax XOM Option Income Strategy ETF [XOMO]
XOMO had total dividends of $11.4696 from 8/31/2023 to 8/14/2026. It has been active for 35.46 months. During that time frame it had a starting price of $20.00, a high price of $23.38, a low price of $10.38, and a 8/14/2026 price of $11.21. This means that it had a yield of 57.35%, or an average monthly yield of 1.62%. The peak-to-valley is -55.60%. The capital gains were -43.95%. The overall gain/loss (cap gains + yield) is 13.40%, or a gain/loss per month of 0.38%. The average volume since inception was 57,240.
XOMO received a recent dividend of $0.0890 on 8/14/2026. This means the current yield ($0.0890 / $11.21 * weeks/months per year paid) is 41.28%.
[30] YieldMax BRK B Option Income Strategy ETF [BRKC]
BRKC had total dividends of $9.8518 from 6/5/2025 to 8/14/2026. It has been active for 14.3 months. During that time frame it had a starting price of $49.68, a high price of $50.66, a low price of $39.58, and a 8/14/2026 price of $40.03. This means that it had a yield of 19.83%, or an average monthly yield of 1.39%. The peak-to-valley is -21.87%. The capital gains were -19.42%. The overall gain/loss (cap gains + yield) is 0.41%, or a gain/loss per month of 0.03%. The average volume since inception was 12,737.
BRKC received a recent dividend of $0.1512 on 8/14/2026. This means the current yield ($0.1512 / $40.03 * weeks/months per year paid) is 19.64%.
[31] YieldMax Crypto Industry & Tech Port Opt Inc ETF [LFGY]
LFGY had total dividends of $31.1343 from 1/14/2025 to 8/14/2026. It has been active for 19 months. During that time frame it had a starting price of $51.25, a high price of $55.11, a low price of $18.36, and a 8/14/2026 price of $19.20. This means that it had a yield of 60.75%, or an average monthly yield of 3.20%. The peak-to-valley is -66.68%. The capital gains were -62.54%. The overall gain/loss (cap gains + yield) is -1.79%, or a gain/loss per month of -0.09%. The average volume since inception was 116,953.
LFGY received a recent dividend of $0.1658 on 8/13/2026. This means the current yield ($0.1658 / $19.20 * weeks/months per year paid) is 44.90%.
[32] YieldMax SPCX Option Income Strategy ETF [YSPC]
YSPC had total dividends of $1.7954 from 7/15/2026 to 8/14/2026. It has been active for 0.99 months. During that time frame it had a starting price of $49.96, a high price of $52.10, a low price of $40.83, and a 8/14/2026 price of $48.05. This means that it had a yield of 3.59%, or an average monthly yield of 3.64%. The peak-to-valley is -21.63%. The capital gains were -3.82%. The overall gain/loss (cap gains + yield) is -0.23%, or a gain/loss per month of -0.23%. The average volume since inception was 8,841.
YSPC received a recent dividend of $0.7793 on 8/14/2026. This means the current yield ($0.7793 / $48.05 * weeks/months per year paid) is 84.34%.
[33] YieldMax Short N100 Option Income Strategy ETF [YQQQ]
YQQQ had total dividends of $7.0654 from 8/15/2024 to 8/14/2026. It has been active for 23.99 months. During that time frame it had a starting price of $19.64, a high price of $20.55, a low price of $9.58, and a 8/14/2026 price of $9.65. This means that it had a yield of 35.97%, or an average monthly yield of 1.50%. The peak-to-valley is -53.38%. The capital gains were -50.87%. The overall gain/loss (cap gains + yield) is -14.89%, or a gain/loss per month of -0.62%. The average volume since inception was 45,879.
YQQQ received a recent dividend of $0.0392 on 8/14/2026. This means the current yield ($0.0392 / $9.65 * weeks/months per year paid) is 21.12%.
[34] YieldMax TSLA Performance Distribution Target 25 ETF [TEST]
TEST had total dividends of $8.2753 from 11/18/2025 to 8/14/2026. It has been active for 8.89 months. During that time frame it had a starting price of $49.66, a high price of $57.74, a low price of $33.40, and a 8/14/2026 price of $36.88. This means that it had a yield of 16.66%, or an average monthly yield of 1.87%. The peak-to-valley is -42.15%. The capital gains were -25.73%. The overall gain/loss (cap gains + yield) is -9.07%, or a gain/loss per month of -1.02%. The average volume since inception was 2,053.
TEST received a recent dividend of $0.1734 on 8/12/2026. This means the current yield ($0.1734 / $36.88 * weeks/months per year paid) is 24.45%.
[35] YieldMax SMCI Option Income Strategy ETF [SMCY]
SMCY had total dividends of $31.9064 from 9/12/2024 to 8/14/2026. It has been active for 23.07 months. During that time frame it had a starting price of $50.62, a high price of $59.20, a low price of $3.99, and a 8/14/2026 price of $5.68. This means that it had a yield of 63.03%, or an average monthly yield of 2.73%. The peak-to-valley is -93.26%. The capital gains were -88.78%. The overall gain/loss (cap gains + yield) is -25.75%, or a gain/loss per month of -1.12%. The average volume since inception was 821,998.
SMCY received a recent dividend of $0.0694 on 8/14/2026. This means the current yield ($0.0694 / $5.68 * weeks/months per year paid) is 63.54%.
[36] YieldMax Ultra Short Option Income Strategy ETF [SLTY]
SLTY had total dividends of $20.4383 from 8/21/2025 to 8/14/2026. It has been active for 11.79 months. During that time frame it had a starting price of $49.96, a high price of $50.47, a low price of $20.68, and a 8/14/2026 price of $20.88. This means that it had a yield of 40.91%, or an average monthly yield of 3.47%. The peak-to-valley is -59.03%. The capital gains were -58.21%. The overall gain/loss (cap gains + yield) is -17.30%, or a gain/loss per month of -1.47%. The average volume since inception was 36,149.
SLTY received a recent dividend of $0.2262 on 8/13/2026. This means the current yield ($0.2262 / $20.88 * weeks/months per year paid) is 56.33%.
[37] YieldMax GME Option Income Strategy ETF [GMEY]
GMEY had total dividends of $17.4135 from 9/9/2025 to 8/14/2026. It has been active for 11.16 months. During that time frame it had a starting price of $50.43, a high price of $56.15, a low price of $23.42, and a 8/14/2026 price of $23.61. This means that it had a yield of 34.53%, or an average monthly yield of 3.09%. The peak-to-valley is -58.29%. The capital gains were -53.18%. The overall gain/loss (cap gains + yield) is -18.65%, or a gain/loss per month of -1.67%. The average volume since inception was 7,828.
GMEY received a recent dividend of $0.1399 on 8/14/2026. This means the current yield ($0.1399 / $23.61 * weeks/months per year paid) is 30.81%.
[38] YieldMax MARA Option Income Strategy ETF [MARO]
MARO had total dividends of $24.6423 from 12/10/2024 to 8/14/2026. It has been active for 20.13 months. During that time frame it had a starting price of $47.14, a high price of $53.06, a low price of $3.79, and a 8/14/2026 price of $3.86. This means that it had a yield of 52.27%, or an average monthly yield of 2.60%. The peak-to-valley is -92.86%. The capital gains were -91.81%. The overall gain/loss (cap gains + yield) is -39.54%, or a gain/loss per month of -1.96%. The average volume since inception was 253,163.
MARO received a recent dividend of $0.0551 on 8/14/2026. This means the current yield ($0.0551 / $3.86 * weeks/months per year paid) is 74.23%.
[39] YieldMax Strat Metals & Mining Portfolio Opt Inc [MINY]
MINY had total dividends of $5.7517 from 2/27/2026 to 8/14/2026. It has been active for 5.59 months. During that time frame it had a starting price of $50.29, a high price of $51.40, a low price of $34.30, and a 8/14/2026 price of $38.98. This means that it had a yield of 11.44%, or an average monthly yield of 2.05%. The peak-to-valley is -33.27%. The capital gains were -22.49%. The overall gain/loss (cap gains + yield) is -11.05%, or a gain/loss per month of -1.98%. The average volume since inception was 6,004.
MINY received a recent dividend of $0.2310 on 8/13/2026. This means the current yield ($0.2310 / $38.98 * weeks/months per year paid) is 30.82%.
[40] YieldMax RDDT Option Income Strategy ETF [RDYY]
RDYY had total dividends of $21.0351 from 9/9/2025 to 8/14/2026. It has been active for 11.16 months. During that time frame it had a starting price of $51.29, a high price of $56.57, a low price of $14.93, and a 8/14/2026 price of $18.06. This means that it had a yield of 41.01%, or an average monthly yield of 3.67%. The peak-to-valley is -73.61%. The capital gains were -64.79%. The overall gain/loss (cap gains + yield) is -23.78%, or a gain/loss per month of -2.13%. The average volume since inception was 38,569.
RDYY received a recent dividend of $0.2307 on 8/14/2026. This means the current yield ($0.2307 / $18.06 * weeks/months per year paid) is 66.43%.
[41] Yieldmax Intc Option Income Strategy ETF [INYY]
INYY had total dividends of $7.7863 from 6/3/2026 to 8/14/2026. It has been active for 2.36 months. During that time frame it had a starting price of $51.88, a high price of $60.63, a low price of $35.42, and a 8/14/2026 price of $40.81. This means that it had a yield of 15.01%, or an average monthly yield of 6.36%. The peak-to-valley is -41.58%. The capital gains were -21.34%. The overall gain/loss (cap gains + yield) is -6.33%, or a gain/loss per month of -2.68%. The average volume since inception was 45,400.
INYY received a recent dividend of $0.6610 on 8/14/2026. This means the current yield ($0.6610 / $40.81 * weeks/months per year paid) is 84.22%.
[42] YieldMax DKNG Option Income Strategy ETF [DRAY]
DRAY had total dividends of $17.1379 from 7/15/2025 to 8/14/2026. It has been active for 12.99 months. During that time frame it had a starting price of $50.09, a high price of $53.95, a low price of $13.30, and a 8/14/2026 price of $15.41. This means that it had a yield of 34.21%, or an average monthly yield of 2.63%. The peak-to-valley is -75.35%. The capital gains were -69.24%. The overall gain/loss (cap gains + yield) is -35.02%, or a gain/loss per month of -2.70%. The average volume since inception was 14,500.
DRAY received a recent dividend of $0.1521 on 8/14/2026. This means the current yield ($0.1521 / $15.41 * weeks/months per year paid) is 51.33%.
[43] YieldMax CRCL Option Income Strategy ETF [CRCO]
CRCO had total dividends of $20.0428 from 9/30/2025 to 8/14/2026. It has been active for 10.49 months. During that time frame it had a starting price of $49.21, a high price of $57.31, a low price of $11.70, and a 8/14/2026 price of $13.17. This means that it had a yield of 40.73%, or an average monthly yield of 3.88%. The peak-to-valley is -79.58%. The capital gains were -73.24%. The overall gain/loss (cap gains + yield) is -32.51%, or a gain/loss per month of -3.10%. The average volume since inception was 70,214.
CRCO received a recent dividend of $0.2205 on 8/14/2026. This means the current yield ($0.2205 / $13.17 * weeks/months per year paid) is 87.06%.
[44] YieldMax RBLX Option Income Strategy ETF [RBLY]
RBLY had total dividends of $17.7416 from 7/29/2025 to 8/14/2026. It has been active for 12.53 months. During that time frame it had a starting price of $49.34, a high price of $58.42, a low price of $8.43, and a 8/14/2026 price of $9.06. This means that it had a yield of 35.96%, or an average monthly yield of 2.87%. The peak-to-valley is -85.57%. The capital gains were -81.64%. The overall gain/loss (cap gains + yield) is -45.68%, or a gain/loss per month of -3.65%. The average volume since inception was 17,298.
RBLY received a recent dividend of $0.1194 on 8/14/2026. This means the current yield ($0.1194 / $9.06 * weeks/months per year paid) is 68.53%.
[45] YieldMax HIMS Option Income Strategy ETF [HIYY]
HIYY had total dividends of $16.0086 from 9/23/2025 to 8/14/2026. It has been active for 10.72 months. During that time frame it had a starting price of $48.32, a high price of $53.97, a low price of $9.53, and a 8/14/2026 price of $12.43. This means that it had a yield of 33.13%, or an average monthly yield of 3.09%. The peak-to-valley is -82.34%. The capital gains were -74.28%. The overall gain/loss (cap gains + yield) is -41.15%, or a gain/loss per month of -3.84%. The average volume since inception was 49,562.
HIYY received a recent dividend of $0.2204 on 8/14/2026. This means the current yield ($0.2204 / $12.43 * weeks/months per year paid) is 92.20%.
[46] YieldMax MSTR Performance & Distribution Tg 25 ETF [MSST]
MSST had total dividends of $6.2638 from 11/18/2025 to 8/14/2026. It has been active for 8.89 months. During that time frame it had a starting price of $53.14, a high price of $54.29, a low price of $19.41, and a 8/14/2026 price of $22.04. This means that it had a yield of 11.79%, or an average monthly yield of 1.33%. The peak-to-valley is -64.25%. The capital gains were -58.52%. The overall gain/loss (cap gains + yield) is -46.74%, or a gain/loss per month of -5.26%. The average volume since inception was 2,248.
MSST received a recent dividend of $0.1124 on 8/12/2026. This means the current yield ($0.1124 / $22.04 * weeks/months per year paid) is 26.52%.