
YIELDMAX -- Yield + Capital Gain Analysis 3/13/2026
A more realistic view of current yield trends

As always, please read our disclaimer. Important!
If you want to skip right to the data, scroll down to the “Individual Stock Analysis” section below.
YieldMax’s Reverse Splits
Last year, YieldMax executed a massive reverse split across 15 of its products.
Rather than rehash the full discussion which we covered in detail here…

…we’ll simply note the practical issue: YieldMax has still not properly reverse-adjusted its dividend reporting — something most firms handle as a matter of course.
As a result, we are again skipping the affected products in this week’s analysis. They will not appear below.
Tickers excluded:
ABNY, AIYY, AMDY, CONY, CRSH, DIPS, FIAT, MRNY, MSTY, OARK, PYPY, TSLY, ULTY, XYZY, YBIT
The Current Yield Conundrum
We recently published a post on NAV erosion that directly addresses reverse-split dynamics in the covered-call ETF space.
No need to repeat it all here — but that post is worth reading:

The core point of the post is simple:
If an ETF pays massive distributions, that money must come from somewhere.
Covered-call ETFs are marketed as generating income from option premiums.
In practice, many also rely heavily on Return of Capital (ROC) — meaning part of the “distribution” is simply your own money being handed back to you to inflate the headline yield.
ROC functions a bit like a reverse mortgage:
You receive steady payments
The underlying asset slowly deteriorates
With a reverse mortgage, everyone understands the bank eventually owns the house.
With covered-call ETFs + ROC, many investors don’t realize the same dynamic can apply: principal can erode while the fund continues mailing out large checks.
Investors see huge yields and assume they’ll keep both:
their original investment
all that income
But if distributions are largely ROC, NAV can fall as fast as — or faster than — payouts.
The result? Eye-popping distributions… and still a negative total return.
Which brings us back to the main takeaway of the post:
Current yield isn’t necessarily what everyone thinks it is.
Do check out the post:
YieldMax General Info
Given the continued popularity of YieldMax, we’re continuing to evaluate all of their products based on a more meaningful metric:
Yield + Capital Gain
Almost all YieldMax funds have now transitioned to a weekly pay model. The only exceptions (for now) are:
BIGY
RNTY
SOXY
Those remain monthly payers.
We are keeping YieldMax separate from the broader weekly-payer universe — because covering 100+ stocks in one post is simply too much.
If you want to see the rest of the weekly payer universe, that is available here:

Analysis Tables
Here is some useful data:
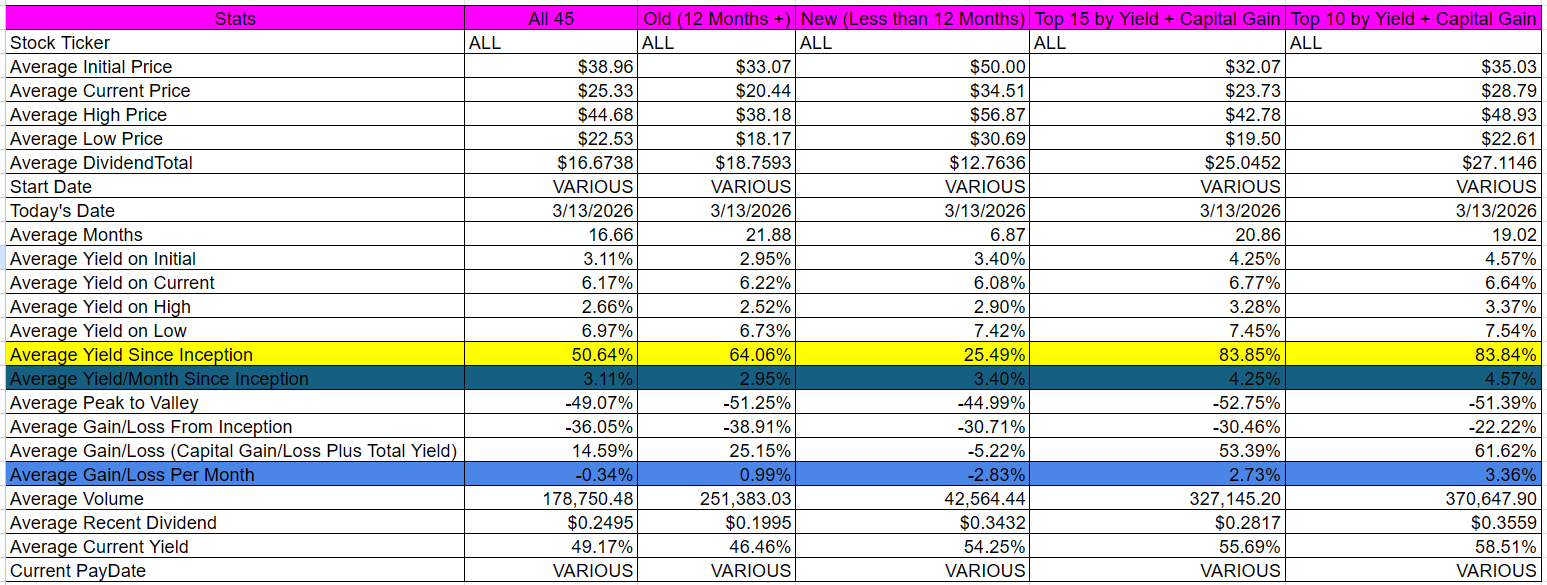
First, an averages table for all YieldMax products covered in this post. The columns in the table below from left-to-right are:
All 46 products
All products with GREATER than 12 months of performance history
All products with LESS than 12 months of performance history
Top 15 by yield + capital gain
Top 10 by yield + capital gain
Second, a Top 15 list by yield + capital gain normalized by months in existence:
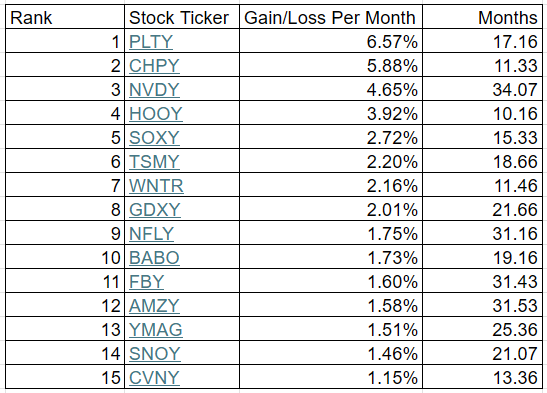
Important notes:
Figures in the Top 15 list are yield + capital gain normalized by months in existence
(Total yield + total capital gain) ÷ months since inception
This is NOT current yield
All data is calculated since inception
These reflect full historical records — not necessarily current trends
Dividends are calculated using the Ex-EFF Date
Support the Work
This is a free post.
If you find this analysis useful and want to see more of what we’re building, consider a paid subscription:
$5/month or $60/year
Or if you don’t want a subscription but still found this useful — send us a coffee or beer!

Also of note:
We recently completed our January run:
26 sectors
647 dividend-paying stocks
You can find an index to all of the January Run posts here:

As well as our February coverage of 12 companies specializing in dividend-paying ETFs (Roundhill, Amplify, Neos, and others):

In other words… it’s a good time to sign up for a paid subscription.
Tons of dividend data. Just $5/month:
Individual Stock Analysis (46 Entries)
In the list of individual stocks below, everything is sorted by descending yield + capital gain (bolded in each first paragraph). This is a far more useful metric than current yield alone.
Current yield is still listed — just not prioritized.
And before jumping headfirst into The River of Current Yield, make sure to read the full first paragraph of each entry.
Fair warning.
Occasionally, we may hold positions in some of these stocks.
[1] YieldMax PLTR Option Income Strategy ETF [PLTY]
PLTY had total dividends of $68.4377 from 10/8/2024 to 3/13/2026. It has been active for 17.16 months. During that time frame it had a starting price of $51.43, a high price of $95.08, a low price of $35.96, and a 3/13/2026 price of $40.99. This means that it had a yield of 133.07%, or an average monthly yield of 7.75%. The peak-to-valley is -62.18%.* The capital gains were -20.30%. The overall gain/loss (cap gains + yield) is 112.77%, or a gain/loss per month of 6.57%. The average volume since inception was 315,795.
PLTY received a recent dividend of $0.7999 on 3/13/2026. This means the current yield ($0.7999 / $40.99 * weeks/months per year paid) is 101.48%.
*For a discussion of how Dividend Farmer calculates “peak-to-valley,” please see the FAQ.
[2] YieldMax Semiconductor Portfolio Option Income ETF [CHPY]
CHPY had total dividends of $20.6568 from 4/3/2025 to 3/13/2026. It has been active for 11.33 months. During that time frame it had a starting price of $45.65, a high price of $62.04, a low price of $40.40, and a 3/13/2026 price of $55.42. This means that it had a yield of 45.25%, or an average monthly yield of 3.99%. The peak-to-valley is -34.88%. The capital gains were 21.40%. The overall gain/loss (cap gains + yield) is 66.65%, or a gain/loss per month of 5.88%. The average volume since inception was 111,115.
CHPY received a recent dividend of $0.4384 on 3/12/2026. This means the current yield ($0.4384 / $55.42 * weeks/months per year paid) is 41.13%.
[3] YieldMax NVDA Option Income Strategy ETF [NVDY]
NVDY had total dividends of $37.9019 from 5/11/2023 to 3/13/2026. It has been active for 34.07 months. During that time frame it had a starting price of $19.91, a high price of $31.77, a low price of $12.47, and a 3/13/2026 price of $13.52. This means that it had a yield of 190.37%, or an average monthly yield of 5.59%. The peak-to-valley is -60.75%. The capital gains were -32.09%. The overall gain/loss (cap gains + yield) is 158.27%, or a gain/loss per month of 4.65%. The average volume since inception was 2,362,423.
NVDY received a recent dividend of $0.1197 on 3/13/2026. This means the current yield ($0.1197 / $13.52 * weeks/months per year paid) is 46.04%.
[4] YieldMax HOOD Option Income Strategy ETF [HOOY]
HOOY had total dividends of $44.0831 from 5/8/2025 to 3/13/2026. It has been active for 10.16 months. During that time frame it had a starting price of $52.82, a high price of $80.99, a low price of $28.40, and a 3/13/2026 price of $29.76. This means that it had a yield of 83.46%, or an average monthly yield of 8.21%. The peak-to-valley is -64.93%. The capital gains were -43.66%. The overall gain/loss (cap gains + yield) is 39.80%, or a gain/loss per month of 3.92%. The average volume since inception was 187,522.
HOOY received a recent dividend of $0.4298 on 3/13/2026. This means the current yield ($0.4298 / $29.76 * weeks/months per year paid) is 75.10%.
[5] YieldMax Target 12 Semiconductor Option Inc ETF [SOXY]
SOXY had total dividends of $8.1643 from 12/3/2024 to 3/13/2026. It has been active for 15.33 months. During that time frame it had a starting price of $50.10, a high price of $70.55, a low price of $35.02, and a 3/13/2026 price of $62.79. This means that it had a yield of 16.30%, or an average monthly yield of 1.06%. The peak-to-valley is -50.36%. The capital gains were 25.33%. The overall gain/loss (cap gains + yield) is 41.63%, or a gain/loss per month of 2.72%. The average volume since inception was 5,760.
SOXY received a recent dividend of $0.6733 on 3/5/2026. This means the current yield ($0.6733 / $62.79 * weeks/months per year paid) is 12.87%.
[6] YieldMax TSM Option Income Strategy ETF [TSMY]
TSMY had total dividends of $12.9953 from 8/21/2024 to 3/13/2026. It has been active for 18.66 months. During that time frame it had a starting price of $20.03, a high price of $22.31, a low price of $12.10, and a 3/13/2026 price of $15.25. This means that it had a yield of 64.88%, or an average monthly yield of 3.48%. The peak-to-valley is -45.76%. The capital gains were -23.86%. The overall gain/loss (cap gains + yield) is 41.01%, or a gain/loss per month of 2.20%. The average volume since inception was 91,160.
TSMY received a recent dividend of $0.1246 on 3/13/2026. This means the current yield ($0.1246 / $15.25 * weeks/months per year paid) is 42.49%.
[7] YieldMax MSTR Short Option Income Strategy ETF [WNTR]
WNTR had total dividends of $29.4226 from 3/27/2025 to 3/13/2026. It has been active for 11.46 months. During that time frame it had a starting price of $50.06, a high price of $60.64, a low price of $27.24, and a 3/13/2026 price of $33.05. This means that it had a yield of 58.77%, or an average monthly yield of 5.13%. The peak-to-valley is -55.08%. The capital gains were -33.98%. The overall gain/loss (cap gains + yield) is 24.80%, or a gain/loss per month of 2.16%. The average volume since inception was 134,004.
WNTR received a recent dividend of $0.5468 on 3/13/2026. This means the current yield ($0.5468 / $33.05 * weeks/months per year paid) is 86.03%.
[8] YieldMax Gold Miners Option Income Strategy ETF [GDXY]
GDXY had total dividends of $13.8319 from 5/21/2024 to 3/13/2026. It has been active for 21.66 months. During that time frame it had a starting price of $19.85, a high price of $19.98, a low price of $14.18, and a 3/13/2026 price of $14.67. This means that it had a yield of 69.68%, or an average monthly yield of 3.22%. The peak-to-valley is -29.03%. The capital gains were -26.10%. The overall gain/loss (cap gains + yield) is 43.59%, or a gain/loss per month of 2.01%. The average volume since inception was 300,441.
GDXY received a recent dividend of $0.1601 on 3/13/2026. This means the current yield ($0.1601 / $14.67 * weeks/months per year paid) is 56.75%.
[9] YieldMax NFLX Option Income Strategy ETF [NFLY]
NFLY had total dividends of $19.6003 from 8/8/2023 to 3/13/2026. It has been active for 31.16 months. During that time frame it had a starting price of $19.99, a high price of $20.36, a low price of $9.60, and a 3/13/2026 price of $11.28. This means that it had a yield of 98.05%, or an average monthly yield of 3.15%. The peak-to-valley is -52.85%. The capital gains were -43.57%. The overall gain/loss (cap gains + yield) is 54.48%, or a gain/loss per month of 1.75%. The average volume since inception was 122,970.
NFLY received a recent dividend of $0.1771 on 3/13/2026. This means the current yield ($0.1771 / $11.28 * weeks/months per year paid) is 81.64%.
[10] YieldMax BABA Option Income Strategy ETF [BABO]
BABO had total dividends of $16.0520 from 8/8/2024 to 3/13/2026. It has been active for 19.16 months. During that time frame it had a starting price of $20.42, a high price of $25.53, a low price of $10.70, and a 3/13/2026 price of $11.15. This means that it had a yield of 78.61%, or an average monthly yield of 4.10%. The peak-to-valley is -58.09%. The capital gains were -45.40%. The overall gain/loss (cap gains + yield) is 33.21%, or a gain/loss per month of 1.73%. The average volume since inception was 75,289.
BABO received a recent dividend of $0.0892 on 3/13/2026. This means the current yield ($0.0892 / $11.15 * weeks/months per year paid) is 41.60%.
[11] YieldMax META Option Income Strategy ETF [FBY]
FBY had total dividends of $19.9848 from 7/28/2023 to 3/13/2026. It has been active for 31.43 months. During that time frame it had a starting price of $20.63, a high price of $24.49, a low price of $10.99, and a 3/13/2026 price of $11.05. This means that it had a yield of 96.87%, or an average monthly yield of 3.08%. The peak-to-valley is -55.12%. The capital gains were -46.44%. The overall gain/loss (cap gains + yield) is 50.44%, or a gain/loss per month of 1.60%. The average volume since inception was 126,481.
FBY received a recent dividend of $0.0754 on 3/13/2026. This means the current yield ($0.0754 / $11.05 * weeks/months per year paid) is 35.48%.
[12] YieldMax AMZN Option Income Strategy ETF [AMZY]
AMZY had total dividends of $18.9808 from 7/25/2023 to 3/13/2026. It has been active for 31.53 months. During that time frame it had a starting price of $20.05, a high price of $24.10, a low price of $10.91, and a 3/13/2026 price of $11.06. This means that it had a yield of 94.67%, or an average monthly yield of 3.00%. The peak-to-valley is -54.73%. The capital gains were -44.84%. The overall gain/loss (cap gains + yield) is 49.83%, or a gain/loss per month of 1.58%. The average volume since inception was 271,054.
AMZY received a recent dividend of $0.0841 on 3/13/2026. This means the current yield ($0.0841 / $11.06 * weeks/months per year paid) is 39.54%.
[13] YieldMax Magnificent 7 Fund of Option Income ETFs [YMAG]
YMAG had total dividends of $15.0802 from 1/30/2024 to 3/13/2026. It has been active for 25.36 months. During that time frame it had a starting price of $19.89, a high price of $21.91, a low price of $12.43, and a 3/13/2026 price of $12.44. This means that it had a yield of 75.82%, or an average monthly yield of 2.99%. The peak-to-valley is -43.27%. The capital gains were -37.46%. The overall gain/loss (cap gains + yield) is 38.36%, or a gain/loss per month of 1.51%. The average volume since inception was 625,952.
YMAG received a recent dividend of $0.0944 on 3/12/2026. This means the current yield ($0.0944 / $12.44 * weeks/months per year paid) is 39.46%.
[14] YieldMax SNOW Option Income Strategy ETF [SNOY]
SNOY had total dividends of $17.2444 from 6/11/2024 to 3/13/2026. It has been active for 21.07 months. During that time frame it had a starting price of $20.18, a high price of $23.76, a low price of $8.28, and a 3/13/2026 price of $9.13. This means that it had a yield of 85.45%, or an average monthly yield of 4.06%. The peak-to-valley is -65.15%. The capital gains were -54.76%. The overall gain/loss (cap gains + yield) is 30.70%, or a gain/loss per month of 1.46%. The average volume since inception was 112,725.
SNOY received a recent dividend of $0.1344 on 3/13/2026. This means the current yield ($0.1344 / $9.13 * weeks/months per year paid) is 76.55%.
[15] YieldMax CVNA Option Income Strategy ETF [CVNY]
CVNY had total dividends of $33.2425 from 1/30/2025 to 3/13/2026. It has been active for 13.36 months. During that time frame it had a starting price of $50.00, a high price of $58.17, a low price of $23.79, and a 3/13/2026 price of $24.43. This means that it had a yield of 66.49%, or an average monthly yield of 4.98%. The peak-to-valley is -59.10%. The capital gains were -51.14%. The overall gain/loss (cap gains + yield) is 15.35%, or a gain/loss per month of 1.15%. The average volume since inception was 64,487.
CVNY received a recent dividend of $0.2783 on 3/13/2026. This means the current yield ($0.2783 / $24.43 * weeks/months per year paid) is 59.24%.
[16] YieldMax GOOGL Option Income Strategy ETF [GOOY]
GOOY had total dividends of $14.0262 from 7/28/2023 to 3/13/2026. It has been active for 31.43 months. During that time frame it had a starting price of $20.50, a high price of $20.83, a low price of $10.89, and a 3/13/2026 price of $13.43. This means that it had a yield of 68.42%, or an average monthly yield of 2.18%. The peak-to-valley is -47.72%. The capital gains were -34.49%. The overall gain/loss (cap gains + yield) is 33.93%, or a gain/loss per month of 1.08%. The average volume since inception was 163,695.
GOOY received a recent dividend of $0.0871 on 3/13/2026. This means the current yield ($0.0871 / $13.43 * weeks/months per year paid) is 33.72%.
[17] YieldMax NVDA Performance Distribution Target 25 ETF [NVIT]
NVIT had total dividends of $3.5338 from 11/18/2025 to 3/13/2026. It has been active for 3.76 months. During that time frame it had a starting price of $49.25, a high price of $52.27, a low price of $45.67, and a 3/13/2026 price of $47.70. This means that it had a yield of 7.18%, or an average monthly yield of 1.91%. The peak-to-valley is -12.63%. The capital gains were -3.15%. The overall gain/loss (cap gains + yield) is 4.03%, or a gain/loss per month of 1.07%. The average volume since inception was 3,926.
NVIT received a recent dividend of $0.2266 on 3/11/2026. This means the current yield ($0.2266 / $47.70 * weeks/months per year paid) is 24.70%.
[18] YieldMax MSFT Option Income Strategy ETF [MSFO]
MSFO had total dividends of $13.8012 from 8/25/2023 to 3/13/2026. It has been active for 30.53 months. During that time frame it had a starting price of $20.18, a high price of $23.48, a low price of $12.27, and a 3/13/2026 price of $12.43. This means that it had a yield of 68.39%, or an average monthly yield of 2.24%. The peak-to-valley is -47.74%. The capital gains were -38.40%. The overall gain/loss (cap gains + yield) is 29.99%, or a gain/loss per month of 0.98%. The average volume since inception was 67,696.
MSFO received a recent dividend of $0.0779 on 3/13/2026. This means the current yield ($0.0779 / $12.43 * weeks/months per year paid) is 32.59%.
[19] YieldMax Universe Fund of Option Income ETFs [YMAX]
YMAX had total dividends of $16.1500 from 1/17/2024 to 3/13/2026. It has been active for 25.79 months. During that time frame it had a starting price of $19.90, a high price of $21.94, a low price of $8.24, and a 3/13/2026 price of $8.32. This means that it had a yield of 81.16%, or an average monthly yield of 3.15%. The peak-to-valley is -62.44%. The capital gains were -58.19%. The overall gain/loss (cap gains + yield) is 22.96%, or a gain/loss per month of 0.89%. The average volume since inception was 1,449,940.
YMAX received a recent dividend of $0.0827 on 3/12/2026. This means the current yield ($0.0827 / $8.32 * weeks/months per year paid) is 51.69%.
[20] YieldMax JP Option Income Strategy ETF [JPO]
JPO had total dividends of $11.7224 from 9/12/2023 to 3/13/2026. It has been active for 30.03 months. During that time frame it had a starting price of $20.06, a high price of $22.30, a low price of $13.32, and a 3/13/2026 price of $13.51. This means that it had a yield of 58.44%, or an average monthly yield of 1.95%. The peak-to-valley is -40.27%. The capital gains were -32.65%. The overall gain/loss (cap gains + yield) is 25.78%, or a gain/loss per month of 0.86%. The average volume since inception was 29,782.
JPO received a recent dividend of $0.0678 on 3/13/2026. This means the current yield ($0.0678 / $13.51 * weeks/months per year paid) is 26.10%.
[21] YieldMax Target 12 Big 50 Option Income ETF [BIGY]
BIGY had total dividends of $7.5979 from 11/21/2024 to 3/13/2026. It has been active for 15.66 months. During that time frame it had a starting price of $50.15, a high price of $54.64, a low price of $40.00, and a 3/13/2026 price of $49.09. This means that it had a yield of 15.15%, or an average monthly yield of 0.97%. The peak-to-valley is -26.79%. The capital gains were -2.11%. The overall gain/loss (cap gains + yield) is 13.04%, or a gain/loss per month of 0.83%. The average volume since inception was 6,738.
BIGY received a recent dividend of $0.5099 on 3/5/2026. This means the current yield ($0.5099 / $49.09 * weeks/months per year paid) is 12.46%.
[22] YieldMax Target 12 Real Estate Option Income ETF [RNTY]
RNTY had total dividends of $5.0631 from 4/17/2025 to 3/13/2026. It has been active for 10.79 months. During that time frame it had a starting price of $50.86, a high price of $53.02, a low price of $48.47, and a 3/13/2026 price of $50.17. This means that it had a yield of 9.95%, or an average monthly yield of 0.92%. The peak-to-valley is -8.58%. The capital gains were -1.36%. The overall gain/loss (cap gains + yield) is 8.60%, or a gain/loss per month of 0.80%. The average volume since inception was 4,540.
RNTY received a recent dividend of $0.5237 on 3/5/2026. This means the current yield ($0.5237 / $50.17 * weeks/months per year paid) is 12.53%.
[23] YieldMax Russell 2000 0DTE Covered Call Strat ETF [RDTY]
RDTY had total dividends of $17.3151 from 3/6/2025 to 3/13/2026. It has been active for 12.23 months. During that time frame it had a starting price of $49.21, a high price of $50.07, a low price of $36.46, and a 3/13/2026 price of $36.55. This means that it had a yield of 35.19%, or an average monthly yield of 2.88%. The peak-to-valley is -27.18%. The capital gains were -25.73%. The overall gain/loss (cap gains + yield) is 9.46%, or a gain/loss per month of 0.77%. The average volume since inception was 9,690.
RDTY received a recent dividend of $0.3199 on 3/12/2026. This means the current yield ($0.3199 / $36.55 * weeks/months per year paid) is 45.51%.
[24] YieldMax AI & Tech Portfolio Option Income ETF [GPTY]
GPTY had total dividends of $17.1510 from 1/23/2025 to 3/13/2026. It has been active for 13.59 months. During that time frame it had a starting price of $50.09, a high price of $50.43, a low price of $32.92, and a 3/13/2026 price of $37.34. This means that it had a yield of 34.24%, or an average monthly yield of 2.52%. The peak-to-valley is -34.72%. The capital gains were -25.45%. The overall gain/loss (cap gains + yield) is 8.79%, or a gain/loss per month of 0.65%. The average volume since inception was 36,618.
GPTY received a recent dividend of $0.2605 on 3/12/2026. This means the current yield ($0.2605 / $37.34 * weeks/months per year paid) is 36.28%.
[25] YieldMax AAPL Option Income Strategy ETF [APLY]
APLY had total dividends of $12.7455 from 4/18/2023 to 3/13/2026. It has been active for 34.76 months. During that time frame it had a starting price of $20.20, a high price of $23.02, a low price of $11.58, and a 3/13/2026 price of $11.59. This means that it had a yield of 63.10%, or an average monthly yield of 1.82%. The peak-to-valley is -49.70%. The capital gains were -42.62%. The overall gain/loss (cap gains + yield) is 20.47%, or a gain/loss per month of 0.59%. The average volume since inception was 96,478.
APLY received a recent dividend of $0.0622 on 3/13/2026. This means the current yield ($0.0622 / $11.59 * weeks/months per year paid) is 27.91%.
[26] YieldMax DIS Option Income Strategy ETF [DISO]
DISO had total dividends of $13.0899 from 8/25/2023 to 3/13/2026. It has been active for 30.53 months. During that time frame it had a starting price of $20.16, a high price of $22.69, a low price of $10.15, and a 3/13/2026 price of $10.17. This means that it had a yield of 64.93%, or an average monthly yield of 2.13%. The peak-to-valley is -55.27%. The capital gains were -49.55%. The overall gain/loss (cap gains + yield) is 15.38%, or a gain/loss per month of 0.50%. The average volume since inception was 17,638.
DISO received a recent dividend of $0.0583 on 3/13/2026. This means the current yield ($0.0583 / $10.17 * weeks/months per year paid) is 29.81%.
[27] YieldMax XOM Option Income Strategy ETF [XOMO]
XOMO had total dividends of $9.5364 from 8/31/2023 to 3/13/2026. It has been active for 30.33 months. During that time frame it had a starting price of $20.01, a high price of $23.38, a low price of $11.32, and a 3/13/2026 price of $13.16. This means that it had a yield of 47.66%, or an average monthly yield of 1.57%. The peak-to-valley is -51.58%. The capital gains were -34.23%. The overall gain/loss (cap gains + yield) is 13.43%, or a gain/loss per month of 0.44%. The average volume since inception was 47,705.
XOMO received a recent dividend of $0.0628 on 3/13/2026. This means the current yield ($0.0628 / $13.16 * weeks/months per year paid) is 24.81%.
[28] YieldMax Nasdaq 100 0DTE Covered Call Strategy ETF [QDTY]
QDTY had total dividends of $14.3554 from 2/13/2025 to 3/13/2026. It has been active for 13 months. During that time frame it had a starting price of $50.61, a high price of $52.55, a low price of $36.76, and a 3/13/2026 price of $38.79. This means that it had a yield of 28.36%, or an average monthly yield of 2.18%. The peak-to-valley is -30.05%. The capital gains were -23.36%. The overall gain/loss (cap gains + yield) is 5.01%, or a gain/loss per month of 0.39%. The average volume since inception was 11,433.
QDTY received a recent dividend of $0.3375 on 3/12/2026. This means the current yield ($0.3375 / $38.79 * weeks/months per year paid) is 45.24%.
[29] YieldMax S&P 500 0DTE Covered Call Strategy ETF [SDTY]
SDTY had total dividends of $11.9884 from 2/6/2025 to 3/13/2026. It has been active for 13.23 months. During that time frame it had a starting price of $50.29, a high price of $51.29, a low price of $38.59, and a 3/13/2026 price of $40.75. This means that it had a yield of 23.84%, or an average monthly yield of 1.80%. The peak-to-valley is -24.76%. The capital gains were -18.97%. The overall gain/loss (cap gains + yield) is 4.87%, or a gain/loss per month of 0.37%. The average volume since inception was 10,687.
SDTY received a recent dividend of $0.3075 on 3/12/2026. This means the current yield ($0.3075 / $40.75 * weeks/months per year paid) is 39.24%.
[30] YieldMax TSLA Performance Distribution Target 25 ETF [TEST]
TEST had total dividends of $3.7101 from 11/18/2025 to 3/13/2026. It has been active for 3.76 months. During that time frame it had a starting price of $49.66, a high price of $57.74, a low price of $44.98, and a 3/13/2026 price of $45.83. This means that it had a yield of 7.47%, or an average monthly yield of 1.99%. The peak-to-valley is -22.10%. The capital gains were -7.71%. The overall gain/loss (cap gains + yield) is -0.24%, or a gain/loss per month of -0.06%. The average volume since inception was 2,510.
TEST received a recent dividend of $0.2234 on 3/11/2026. This means the current yield ($0.2234 / $45.83 * weeks/months per year paid) is 25.35%.
[31] YieldMax BRK B Option Income Strategy ETF [BRKC]
BRKC had total dividends of $6.4389 from 6/5/2025 to 3/13/2026. It has been active for 9.26 months. During that time frame it had a starting price of $49.68, a high price of $50.66, a low price of $41.56, and a 3/13/2026 price of $42.71. This means that it had a yield of 12.96%, or an average monthly yield of 1.40%. The peak-to-valley is -17.96%. The capital gains were -14.03%. The overall gain/loss (cap gains + yield) is -1.07%, or a gain/loss per month of -0.12%. The average volume since inception was 13,439.
BRKC received a recent dividend of $0.1496 on 3/13/2026. This means the current yield ($0.1496 / $42.71 * weeks/months per year paid) is 18.21%.
[32] YieldMax Short N100 Option Income Strategy ETF [YQQQ]
YQQQ had total dividends of $5.7989 from 8/15/2024 to 3/13/2026. It has been active for 18.85 months. During that time frame it had a starting price of $19.64, a high price of $20.55, a low price of $11.79, and a 3/13/2026 price of $12.58. This means that it had a yield of 29.53%, or an average monthly yield of 1.57%. The peak-to-valley is -42.63%. The capital gains were -35.95%. The overall gain/loss (cap gains + yield) is -6.42%, or a gain/loss per month of -0.34%. The average volume since inception was 37,947.
YQQQ received a recent dividend of $0.0674 on 3/13/2026. This means the current yield ($0.0674 / $12.58 * weeks/months per year paid) is 27.86%.
[33] YieldMax Crypto Industry & Tech Port Opt Inc ETF [LFGY]
LFGY had total dividends of $26.1734 from 1/14/2025 to 3/13/2026. It has been active for 13.89 months. During that time frame it had a starting price of $51.25, a high price of $55.11, a low price of $19.83, and a 3/13/2026 price of $21.50. This means that it had a yield of 51.07%, or an average monthly yield of 3.68%. The peak-to-valley is -64.02%. The capital gains were -58.05%. The overall gain/loss (cap gains + yield) is -6.98%, or a gain/loss per month of -0.50%. The average volume since inception was 136,183.
LFGY received a recent dividend of $0.2303 on 3/12/2026. This means the current yield ($0.2303 / $21.50 * weeks/months per year paid) is 55.70%.
[34] YieldMax Dorsey Wright Featured 5 Income ETF [FEAT]
FEAT had total dividends of $21.5498 from 12/17/2024 to 3/13/2026. It has been active for 14.79 months. During that time frame it had a starting price of $49.71, a high price of $50.21, a low price of $18.64, and a 3/13/2026 price of $18.74. This means that it had a yield of 43.35%, or an average monthly yield of 2.93%. The peak-to-valley is -62.88%. The capital gains were -62.30%. The overall gain/loss (cap gains + yield) is -18.95%, or a gain/loss per month of -1.28%. The average volume since inception was 24,944.
FEAT received a recent dividend of $0.2315 on 3/12/2026. This means the current yield ($0.2315 / $18.74 * weeks/months per year paid) is 64.24%.
[35] YieldMax Dorsey Wright Hybrid 5 Income ETF [FIVY]
FIVY had total dividends of $16.0493 from 12/17/2024 to 3/13/2026. It has been active for 14.79 months. During that time frame it had a starting price of $49.78, a high price of $52.51, a low price of $23.53, and a 3/13/2026 price of $23.86. This means that it had a yield of 32.24%, or an average monthly yield of 2.18%. The peak-to-valley is -55.19%. The capital gains were -52.07%. The overall gain/loss (cap gains + yield) is -19.83%, or a gain/loss per month of -1.34%. The average volume since inception was 9,685.
FIVY received a recent dividend of $0.1964 on 3/12/2026. This means the current yield ($0.1964 / $23.86 * weeks/months per year paid) is 42.80%.
[36] YieldMax SMCI Option Income Strategy ETF [SMCY]
SMCY had total dividends of $29.8586 from 9/12/2024 to 3/13/2026. It has been active for 18.03 months. During that time frame it had a starting price of $50.62, a high price of $59.20, a low price of $7.30, and a 3/13/2026 price of $7.44. This means that it had a yield of 58.99%, or an average monthly yield of 3.27%. The peak-to-valley is -87.67%. The capital gains were -85.30%. The overall gain/loss (cap gains + yield) is -26.32%, or a gain/loss per month of -1.46%. The average volume since inception was 727,232.
SMCY received a recent dividend of $0.1154 on 3/13/2026. This means the current yield ($0.1154 / $7.44 * weeks/months per year paid) is 80.66%.
[37] YieldMax GME Option Income Strategy ETF [GMEY]
GMEY had total dividends of $11.6110 from 9/9/2025 to 3/13/2026. It has been active for 6.13 months. During that time frame it had a starting price of $50.43, a high price of $56.15, a low price of $33.59, and a 3/13/2026 price of $33.59. This means that it had a yield of 23.02%, or an average monthly yield of 3.76%. The peak-to-valley is -40.18%. The capital gains were -33.39%. The overall gain/loss (cap gains + yield) is -10.37%, or a gain/loss per month of -1.69%. The average volume since inception was 12,513.
GMEY received a recent dividend of $0.3587 on 3/13/2026. This means the current yield ($0.3587 / $33.59 * weeks/months per year paid) is 55.53%.
[38] YieldMax Ultra Short Option Income Strategy ETF [SLTY]
SLTY had total dividends of $13.7765 from 8/21/2025 to 3/13/2026. It has been active for 6.66 months. During that time frame it had a starting price of $49.96, a high price of $50.47, a low price of $27.68, and a 3/13/2026 price of $29.36. This means that it had a yield of 27.58%, or an average monthly yield of 4.14%. The peak-to-valley is -45.16%. The capital gains were -41.23%. The overall gain/loss (cap gains + yield) is -13.66%, or a gain/loss per month of -2.05%. The average volume since inception was 43,920.
SLTY received a recent dividend of $0.3894 on 3/12/2026. This means the current yield ($0.3894 / $29.36 * weeks/months per year paid) is 68.97%.
[39] YieldMax MARA Option Income Strategy ETF [MARO]
MARO had total dividends of $22.3541 from 12/10/2024 to 3/13/2026. It has been active for 15.1 months. During that time frame it had a starting price of $47.14, a high price of $53.06, a low price of $5.05, and a 3/13/2026 price of $6.07. This means that it had a yield of 47.42%, or an average monthly yield of 3.14%. The peak-to-valley is -90.48%. The capital gains were -87.12%. The overall gain/loss (cap gains + yield) is -39.70%, or a gain/loss per month of -2.63%. The average volume since inception was 182,863.
MARO received a recent dividend of $0.0981 on 3/13/2026. This means the current yield ($0.0981 / $6.07 * weeks/months per year paid) is 84.04%.
[40] YieldMax CRCL Option Income Strategy ETF [CRCO]
CRCO had total dividends of $12.4969 from 9/30/2025 to 3/13/2026. It has been active for 5.36 months. During that time frame it had a starting price of $49.21, a high price of $57.31, a low price of $15.01, and a 3/13/2026 price of $28.34. This means that it had a yield of 25.40%, or an average monthly yield of 4.74%. The peak-to-valley is -73.81%. The capital gains were -42.41%. The overall gain/loss (cap gains + yield) is -17.02%, or a gain/loss per month of -3.17%. The average volume since inception was 55,548.
CRCO received a recent dividend of $0.6628 on 3/13/2026. This means the current yield ($0.6628 / $28.34 * weeks/months per year paid) is 121.61%.
[41] YieldMax DKNG Option Income Strategy ETF [DRAY]
DRAY had total dividends of $12.7510 from 7/15/2025 to 3/13/2026. It has been active for 7.85 months. During that time frame it had a starting price of $50.09, a high price of $53.95, a low price of $17.17, and a 3/13/2026 price of $19.45. This means that it had a yield of 25.46%, or an average monthly yield of 3.24%. The peak-to-valley is -68.17%. The capital gains were -61.17%. The overall gain/loss (cap gains + yield) is -35.71%, or a gain/loss per month of -4.55%. The average volume since inception was 18,080.
DRAY received a recent dividend of $0.1879 on 3/13/2026. This means the current yield ($0.1879 / $19.45 * weeks/months per year paid) is 50.24%.
[42] YieldMax RBLX Option Income Strategy ETF [RBLY]
RBLY had total dividends of $13.8186 from 7/29/2025 to 3/13/2026. It has been active for 7.39 months. During that time frame it had a starting price of $49.34, a high price of $58.42, a low price of $18.55, and a 3/13/2026 price of $18.61. This means that it had a yield of 28.01%, or an average monthly yield of 3.79%. The peak-to-valley is -68.25%. The capital gains were -62.28%. The overall gain/loss (cap gains + yield) is -34.28%, or a gain/loss per month of -4.64%. The average volume since inception was 12,294.
RBLY received a recent dividend of $0.2616 on 3/13/2026. This means the current yield ($0.2616 / $18.61 * weeks/months per year paid) is 73.10%.
[43] YieldMax RDDT Option Income Strategy ETF [RDYY]
RDYY had total dividends of $13.6887 from 9/9/2025 to 3/13/2026. It has been active for 6.13 months. During that time frame it had a starting price of $51.29, a high price of $56.57, a low price of $19.85, and a 3/13/2026 price of $19.93. This means that it had a yield of 26.69%, or an average monthly yield of 4.35%. The peak-to-valley is -64.91%. The capital gains were -61.14%. The overall gain/loss (cap gains + yield) is -34.45%, or a gain/loss per month of -5.62%. The average volume since inception was 37,858.
RDYY received a recent dividend of $0.2910 on 3/13/2026. This means the current yield ($0.2910 / $19.93 * weeks/months per year paid) is 75.93%.
[44] YieldMax MSTR Performance & Distribution Tg 25 ETF [MSST]
MSST had total dividends of $2.9302 from 11/18/2025 to 3/13/2026. It has been active for 3.76 months. During that time frame it had a starting price of $53.14, a high price of $54.29, a low price of $28.30, and a 3/13/2026 price of $36.47. This means that it had a yield of 5.51%, or an average monthly yield of 1.47%. The peak-to-valley is -47.87%. The capital gains were -31.37%. The overall gain/loss (cap gains + yield) is -25.86%, or a gain/loss per month of -6.88%. The average volume since inception was 1,929.
MSST received a recent dividend of $0.1682 on 3/11/2026. This means the current yield ($0.1682 / $36.47 * weeks/months per year paid) is 23.98%.
[45] YieldMax HIMS Option Income Strategy ETF [HIYY]
HIYY had total dividends of $9.8239 from 9/23/2025 to 3/13/2026. It has been active for 5.59 months. During that time frame it had a starting price of $48.32, a high price of $53.97, a low price of $9.53, and a 3/13/2026 price of $17.03. This means that it had a yield of 20.33%, or an average monthly yield of 3.64%. The peak-to-valley is -82.34%. The capital gains were -64.76%. The overall gain/loss (cap gains + yield) is -44.42%, or a gain/loss per month of -7.94%. The average volume since inception was 32,526.
HIYY received a recent dividend of $0.2216 on 3/13/2026. This means the current yield ($0.2216 / $17.03 * weeks/months per year paid) is 67.66%.
[46] YieldMax Strat Metals & Mining Portfolio Opt Inc [MINY]
MINY had total dividends of $0.4116 from 2/27/2026 to 3/13/2026. It has been active for 0.46 months. During that time frame it had a starting price of $50.29, a high price of $51.40, a low price of $44.71, and a 3/13/2026 price of $44.71. This means that it had a yield of 0.82%, or an average monthly yield of 1.78%. The peak-to-valley is -13.02%. The capital gains were -11.10%. The overall gain/loss (cap gains + yield) is -10.28%, or a gain/loss per month of -22.33%. The average volume since inception was 9,307.
MINY received a recent dividend of $0.4116 on 3/12/2026. This means the current yield ($0.4116 / $44.71 * weeks/months per year paid) is 47.87%.