
YIELDMAX -- Yield + Capital Gain Analysis 5/22/2026
A more realistic view of current yield trends

As always, please read our disclaimer. Important!
YieldMax’s Reverse Splits
Last year YieldMax executed reverse splits across 15 of its products — and has still not properly reverse-adjusted its dividend reporting, something most firms handle as a matter of course. We covered this in detail here. The affected tickers are excluded from this week’s analysis:
ABNY, AIYY, AMDY, CONY, CRSH, DIPS, FIAT, MRNY, MSTY, OARK, PYPY, TSLY, ULTY, XYZY, YBIT
The Current Yield Problem
Covered-call ETFs are marketed on income from option premiums. In practice, many also lean heavily on Return of Capital (ROC) — meaning part of the “distribution” is simply your own money being handed back to inflate the headline yield.
The dynamic is similar to a reverse mortgage: you receive steady payments while the underlying asset quietly deteriorates. With a reverse mortgage, everyone knows the bank eventually owns the house.
With covered-call ETFs + ROC, many investors don’t realize the same logic can apply — NAV can erode as fast as, or faster than, the payouts. The result: eye-popping distributions and still a negative total return.
Worth reading before diving into the data: Yield + Capital Gains: A More Honest Way to Look at Covered Call ETFs
About This Analysis
We evaluate all YieldMax products on Yield + Capital Gain — a more honest metric than current yield alone.
Almost all YieldMax funds have moved to weekly payouts. The exceptions — BIGY, RNTY, and SOXY — remain monthly payers.
For the broader weekly-payer universe: WEEKLY PAYERS — Yield + Capital Gain Analysis 5/19/2026
Analysis Tables
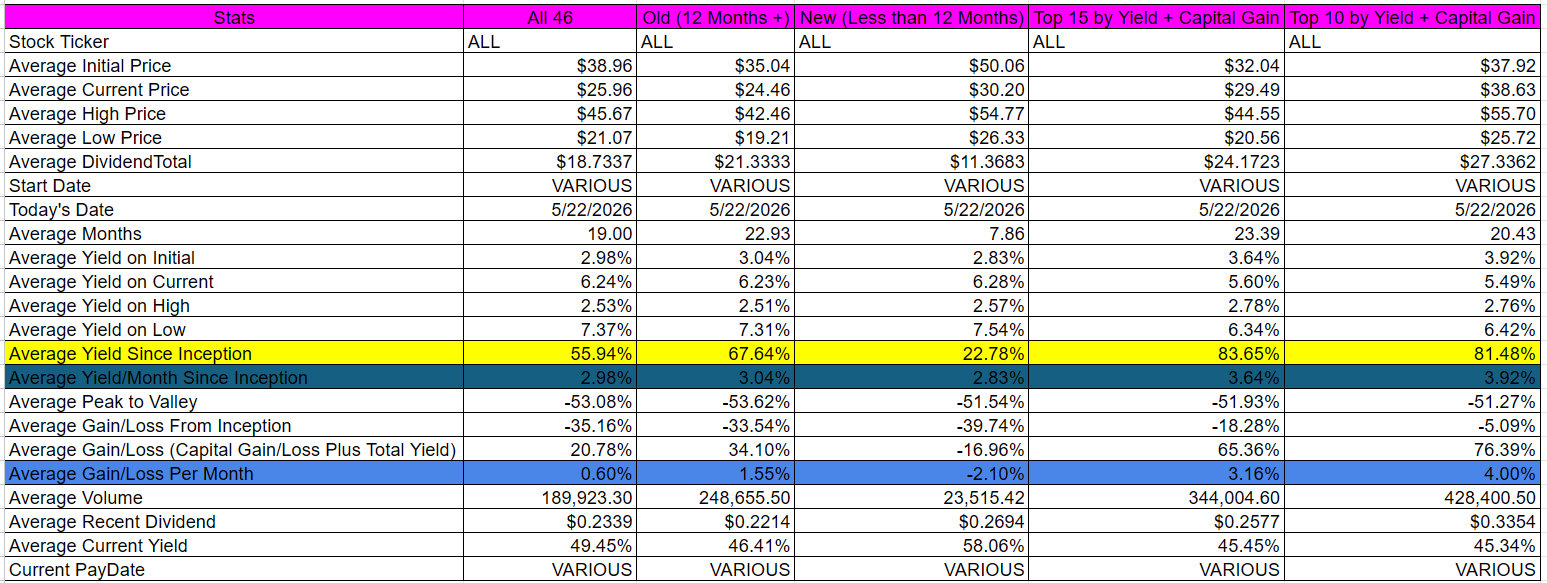
Averages table across five slices — all 46 products, those with more than 12 months of history, those with less, the Top 15, and the Top 10 by yield + capital gain:
Top 15 by yield + capital gain, normalized by months in existence:
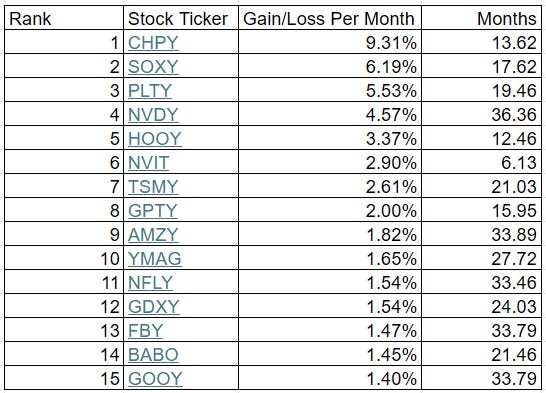
Methodology note:
Figures are (total yield + total capital gain) ÷ months since inception — not current yield
All data is calculated since inception
Dividends use the Ex-EFF Date
Support the Work
The April Run 2026 just wrapped — a good moment to jump in if you’ve been on the fence.
This is a free post; a paid subscription ($5/month or $60/year) goes directly toward keeping this analysis running.
Individual Stock Analysis (46 entries)
Sorted by descending yield + capital gain (bolded in each entry). Current yield is listed but not prioritized. Occasionally we may hold positions in some of these stocks.
[1] YieldMax Semiconductor Portfolio Option Income ETF [CHPY]
CHPY had total dividends of $25.9356 from 4/3/2025 to 5/22/2026. It has been active for 13.62 months. During that time frame it had a starting price of $45.65, a high price of $78.17, a low price of $40.40, and a 5/22/2026 price of $77.60. This means that it had a yield of 56.81%, or an average monthly yield of 4.17%. The peak-to-valley is -48.32%. The capital gains were 69.99%. The overall gain/loss (cap gains + yield) is 126.80%, or a gain/loss per month of 9.31%. The average volume since inception was 184,171.
CHPY received a recent dividend of $0.6444 on 5/21/2026. This means the current yield ($0.6444 / $77.60 * weeks/months per year paid) is 43.18%.
[2] YieldMax Target 12 Semiconductor Option Inc ETF [SOXY]
SOXY had total dividends of $9.6481 from 12/3/2024 to 5/22/2026. It has been active for 17.62 months. During that time frame it had a starting price of $50.10, a high price of $96.00, a low price of $35.02, and a 5/22/2026 price of $95.10. This means that it had a yield of 19.26%, or an average monthly yield of 1.09%. The peak-to-valley is -63.52%. The capital gains were 89.82%. The overall gain/loss (cap gains + yield) is 109.08%, or a gain/loss per month of 6.19%. The average volume since inception was 7,217.
SOXY received a recent dividend of $0.8297 on 5/7/2026. This means the current yield ($0.8297 / $95.10 * weeks/months per year paid) is 10.47%.
[3] YieldMax PLTR Option Income Strategy ETF [PLTY]
PLTY had total dividends of $72.7848 from 10/8/2024 to 5/22/2026. It has been active for 19.46 months. During that time frame it had a starting price of $51.43, a high price of $95.08, a low price of $32.30, and a 5/22/2026 price of $34.02. This means that it had a yield of 141.52%, or an average monthly yield of 7.27%. The peak-to-valley is -66.03%. The capital gains were -33.85%. The overall gain/loss (cap gains + yield) is 107.67%, or a gain/loss per month of 5.53%. The average volume since inception was 306,586.
PLTY received a recent dividend of $0.3565 on 5/22/2026. This means the current yield ($0.3565 / $34.02 * weeks/months per year paid) is 54.49%.
[4] YieldMax NVDA Option Income Strategy ETF [NVDY]
NVDY had total dividends of $39.2583 from 5/11/2023 to 5/22/2026. It has been active for 36.36 months. During that time frame it had a starting price of $19.91, a high price of $31.77, a low price of $12.34, and a 5/22/2026 price of $13.76. This means that it had a yield of 197.18%, or an average monthly yield of 5.42%. The peak-to-valley is -61.16%. The capital gains were -30.89%. The overall gain/loss (cap gains + yield) is 166.29%, or a gain/loss per month of 4.57%. The average volume since inception was 2,517,588.
NVDY received a recent dividend of $0.1354 on 5/22/2026. This means the current yield ($0.1354 / $13.76 * weeks/months per year paid) is 51.17%.
[5] YieldMax HOOD Option Income Strategy ETF [HOOY]
HOOY had total dividends of $48.4848 from 5/8/2025 to 5/22/2026. It has been active for 12.46 months. During that time frame it had a starting price of $52.82, a high price of $80.99, a low price of $25.85, and a 5/22/2026 price of $26.50. This means that it had a yield of 91.79%, or an average monthly yield of 7.37%. The peak-to-valley is -68.08%. The capital gains were -49.83%. The overall gain/loss (cap gains + yield) is 41.96%, or a gain/loss per month of 3.37%. The average volume since inception was 172,477.
HOOY received a recent dividend of $0.3600 on 5/22/2026. This means the current yield ($0.3600 / $26.50 * weeks/months per year paid) is 70.64%.
[6] YieldMax NVDA Performance Distribution Target 25 ETF [NVIT]
NVIT had total dividends of $5.8936 from 11/18/2025 to 5/22/2026. It has been active for 6.13 months. During that time frame it had a starting price of $49.25, a high price of $56.26, a low price of $44.20, and a 5/22/2026 price of $52.12. This means that it had a yield of 11.97%, or an average monthly yield of 1.95%. The peak-to-valley is -21.44%. The capital gains were 5.83%. The overall gain/loss (cap gains + yield) is 17.79%, or a gain/loss per month of 2.90%. The average volume since inception was 4,365.
NVIT received a recent dividend of $0.2612 on 5/20/2026. This means the current yield ($0.2612 / $52.12 * weeks/months per year paid) is 26.06%.
[7] YieldMax TSM Option Income Strategy ETF [TSMY]
TSMY had total dividends of $14.6851 from 8/21/2024 to 5/22/2026. It has been active for 21.03 months. During that time frame it had a starting price of $20.03, a high price of $22.31, a low price of $12.10, and a 5/22/2026 price of $16.33. This means that it had a yield of 73.32%, or an average monthly yield of 3.49%. The peak-to-valley is -45.76%. The capital gains were -18.47%. The overall gain/loss (cap gains + yield) is 54.84%, or a gain/loss per month of 2.61%. The average volume since inception was 101,070.
TSMY received a recent dividend of $0.1659 on 5/22/2026. This means the current yield ($0.1659 / $16.33 * weeks/months per year paid) is 52.83%.
[8] YieldMax AI & Tech Portfolio Option Income ETF [GPTY]
GPTY had total dividends of $20.1885 from 1/23/2025 to 5/22/2026. It has been active for 15.95 months. During that time frame it had a starting price of $50.09, a high price of $50.43, a low price of $32.92, and a 5/22/2026 price of $45.88. This means that it had a yield of 40.30%, or an average monthly yield of 2.53%. The peak-to-valley is -34.72%. The capital gains were -8.40%. The overall gain/loss (cap gains + yield) is 31.90%, or a gain/loss per month of 2.00%. The average volume since inception was 36,788.
GPTY received a recent dividend of $0.3473 on 5/21/2026. This means the current yield ($0.3473 / $45.88 * weeks/months per year paid) is 39.36%.
[9] YieldMax AMZN Option Income Strategy ETF [AMZY]
AMZY had total dividends of $20.2773 from 7/25/2023 to 5/22/2026. It has been active for 33.89 months. During that time frame it had a starting price of $20.05, a high price of $24.10, a low price of $10.61, and a 5/22/2026 price of $12.16. This means that it had a yield of 101.13%, or an average monthly yield of 2.98%. The peak-to-valley is -55.98%. The capital gains were -39.35%. The overall gain/loss (cap gains + yield) is 61.78%, or a gain/loss per month of 1.82%. The average volume since inception was 286,491.
AMZY received a recent dividend of $0.1009 on 5/22/2026. This means the current yield ($0.1009 / $12.16 * weeks/months per year paid) is 43.15%.
[10] YieldMax Magnificent 7 Fund of Option Income ETFs [YMAG]
YMAG had total dividends of $16.2055 from 1/30/2024 to 5/22/2026. It has been active for 27.72 months. During that time frame it had a starting price of $19.89, a high price of $21.91, a low price of $11.47, and a 5/22/2026 price of $12.79. This means that it had a yield of 81.48%, or an average monthly yield of 2.94%. The peak-to-valley is -47.65%. The capital gains were -35.70%. The overall gain/loss (cap gains + yield) is 45.78%, or a gain/loss per month of 1.65%. The average volume since inception was 667,252.
YMAG received a recent dividend of $0.1525 on 5/21/2026. This means the current yield ($0.1525 / $12.79 * weeks/months per year paid) is 62.00%.
[11] YieldMax NFLX Option Income Strategy ETF [NFLY]
NFLY had total dividends of $20.6235 from 8/8/2023 to 5/22/2026. It has been active for 33.46 months. During that time frame it had a starting price of $19.99, a high price of $20.36, a low price of $9.41, and a 5/22/2026 price of $9.68. This means that it had a yield of 103.17%, or an average monthly yield of 3.08%. The peak-to-valley is -53.78%. The capital gains were -51.58%. The overall gain/loss (cap gains + yield) is 51.59%, or a gain/loss per month of 1.54%. The average volume since inception was 126,860.
NFLY received a recent dividend of $0.0626 on 5/22/2026. This means the current yield ($0.0626 / $9.68 * weeks/months per year paid) is 33.63%.
[12] YieldMax Gold Miners Option Income Strategy ETF [GDXY]
GDXY had total dividends of $15.2473 from 5/21/2024 to 5/22/2026. It has been active for 24.03 months. During that time frame it had a starting price of $19.85, a high price of $19.98, a low price of $11.84, and a 5/22/2026 price of $11.94. This means that it had a yield of 76.81%, or an average monthly yield of 3.20%. The peak-to-valley is -40.74%. The capital gains were -39.85%. The overall gain/loss (cap gains + yield) is 36.96%, or a gain/loss per month of 1.54%. The average volume since inception was 362,547.
GDXY received a recent dividend of $0.1083 on 5/22/2026. This means the current yield ($0.1083 / $11.94 * weeks/months per year paid) is 47.17%.
[13] YieldMax META Option Income Strategy ETF [FBY]
FBY had total dividends of $20.8776 from 7/28/2023 to 5/22/2026. It has been active for 33.79 months. During that time frame it had a starting price of $20.63, a high price of $24.49, a low price of $9.40, and a 5/22/2026 price of $10.01. This means that it had a yield of 101.20%, or an average monthly yield of 3.00%. The peak-to-valley is -61.62%. The capital gains were -51.48%. The overall gain/loss (cap gains + yield) is 49.72%, or a gain/loss per month of 1.47%. The average volume since inception was 127,453.
FBY received a recent dividend of $0.0792 on 5/22/2026. This means the current yield ($0.0792 / $10.01 * weeks/months per year paid) is 41.14%.
[14] YieldMax BABA Option Income Strategy ETF [BABO]
BABO had total dividends of $16.9578 from 8/8/2024 to 5/22/2026. It has been active for 21.46 months. During that time frame it had a starting price of $20.42, a high price of $25.53, a low price of $9.60, and a 5/22/2026 price of $9.81. This means that it had a yield of 83.05%, or an average monthly yield of 3.87%. The peak-to-valley is -62.40%. The capital gains were -51.96%. The overall gain/loss (cap gains + yield) is 31.09%, or a gain/loss per month of 1.45%. The average volume since inception was 71,839.
BABO received a recent dividend of $0.0791 on 5/22/2026. This means the current yield ($0.0791 / $9.81 * weeks/months per year paid) is 41.93%.
[15] YieldMax GOOGL Option Income Strategy ETF [GOOY]
GOOY had total dividends of $15.5173 from 7/28/2023 to 5/22/2026. It has been active for 33.79 months. During that time frame it had a starting price of $20.50, a high price of $20.83, a low price of $10.89, and a 5/22/2026 price of $14.66. This means that it had a yield of 75.69%, or an average monthly yield of 2.24%. The peak-to-valley is -47.72%. The capital gains were -28.49%. The overall gain/loss (cap gains + yield) is 47.21%, or a gain/loss per month of 1.40%. The average volume since inception was 187,365.
GOOY received a recent dividend of $0.1818 on 5/22/2026. This means the current yield ($0.1818 / $14.66 * weeks/months per year paid) is 64.49%.
[16] YieldMax CVNA Option Income Strategy ETF [CVNY]
CVNY had total dividends of $37.6293 from 1/30/2025 to 5/22/2026. It has been active for 15.72 months. During that time frame it had a starting price of $50.00, a high price of $58.17, a low price of $21.66, and a 5/22/2026 price of $23.35. This means that it had a yield of 75.26%, or an average monthly yield of 4.79%. The peak-to-valley is -62.76%. The capital gains were -53.30%. The overall gain/loss (cap gains + yield) is 21.96%, or a gain/loss per month of 1.40%. The average volume since inception was 59,241.
CVNY received a recent dividend of $0.3130 on 5/22/2026. This means the current yield ($0.3130 / $23.35 * weeks/months per year paid) is 69.70%.
[17] YieldMax Target 12 Big 50 Option Income ETF [BIGY]
BIGY had total dividends of $8.6091 from 11/21/2024 to 5/22/2026. It has been active for 18.03 months. During that time frame it had a starting price of $50.15, a high price of $54.64, a low price of $40.00, and a 5/22/2026 price of $53.37. This means that it had a yield of 17.17%, or an average monthly yield of 0.95%. The peak-to-valley is -26.79%. The capital gains were 6.42%. The overall gain/loss (cap gains + yield) is 23.59%, or a gain/loss per month of 1.31%. The average volume since inception was 6,713.
BIGY received a recent dividend of $0.5213 on 5/7/2026. This means the current yield ($0.5213 / $53.37 * weeks/months per year paid) is 11.72%.
[18] YieldMax Russell 2000 0DTE Covered Call Strat ETF [RDTY]
RDTY had total dividends of $20.2080 from 3/6/2025 to 5/22/2026. It has been active for 14.53 months. During that time frame it had a starting price of $49.21, a high price of $50.07, a low price of $35.11, and a 5/22/2026 price of $37.80. This means that it had a yield of 41.06%, or an average monthly yield of 2.83%. The peak-to-valley is -29.88%. The capital gains were -23.19%. The overall gain/loss (cap gains + yield) is 17.88%, or a gain/loss per month of 1.23%. The average volume since inception was 11,156.
RDTY received a recent dividend of $0.2382 on 5/21/2026. This means the current yield ($0.2382 / $37.80 * weeks/months per year paid) is 32.77%.
[19] YieldMax SNOW Option Income Strategy ETF [SNOY]
SNOY had total dividends of $18.1693 from 6/11/2024 to 5/22/2026. It has been active for 23.36 months. During that time frame it had a starting price of $20.18, a high price of $23.76, a low price of $6.17, and a 5/22/2026 price of $7.73. This means that it had a yield of 90.04%, or an average monthly yield of 3.85%. The peak-to-valley is -74.03%. The capital gains were -61.69%. The overall gain/loss (cap gains + yield) is 28.34%, or a gain/loss per month of 1.21%. The average volume since inception was 111,252.
SNOY received a recent dividend of $0.0976 on 5/22/2026. This means the current yield ($0.0976 / $7.73 * weeks/months per year paid) is 65.66%.
[20] YieldMax Nasdaq 100 0DTE Covered Call Strategy ETF [QDTY]
QDTY had total dividends of $16.9604 from 2/13/2025 to 5/22/2026. It has been active for 15.3 months. During that time frame it had a starting price of $50.61, a high price of $52.55, a low price of $36.36, and a 5/22/2026 price of $42.39. This means that it had a yield of 33.51%, or an average monthly yield of 2.19%. The peak-to-valley is -30.81%. The capital gains were -16.24%. The overall gain/loss (cap gains + yield) is 17.27%, or a gain/loss per month of 1.13%. The average volume since inception was 12,151.
QDTY received a recent dividend of $0.2227 on 5/21/2026. This means the current yield ($0.2227 / $42.39 * weeks/months per year paid) is 27.32%.
[21] YieldMax MSFT Option Income Strategy ETF [MSFO]
MSFO had total dividends of $14.8518 from 8/25/2023 to 5/22/2026. It has been active for 32.89 months. During that time frame it had a starting price of $20.18, a high price of $23.48, a low price of $11.14, and a 5/22/2026 price of $12.12. This means that it had a yield of 73.60%, or an average monthly yield of 2.24%. The peak-to-valley is -52.56%. The capital gains were -39.94%. The overall gain/loss (cap gains + yield) is 33.66%, or a gain/loss per month of 1.02%. The average volume since inception was 71,896.
MSFO received a recent dividend of $0.0890 on 5/22/2026. This means the current yield ($0.0890 / $12.12 * weeks/months per year paid) is 38.18%.
[22] YieldMax Universe Fund of Option Income ETFs [YMAX]
YMAX had total dividends of $17.0011 from 1/17/2024 to 5/22/2026. It has been active for 28.16 months. During that time frame it had a starting price of $19.90, a high price of $21.94, a low price of $7.47, and a 5/22/2026 price of $8.44. This means that it had a yield of 85.43%, or an average monthly yield of 3.03%. The peak-to-valley is -65.95%. The capital gains were -57.59%. The overall gain/loss (cap gains + yield) is 27.84%, or a gain/loss per month of 0.99%. The average volume since inception was 1,462,927.
YMAX received a recent dividend of $0.0905 on 5/21/2026. This means the current yield ($0.0905 / $8.44 * weeks/months per year paid) is 55.76%.
[23] YieldMax JP Option Income Strategy ETF [JPO]
JPO had total dividends of $12.7137 from 9/12/2023 to 5/22/2026. It has been active for 32.33 months. During that time frame it had a starting price of $20.06, a high price of $22.30, a low price of $13.32, and a 5/22/2026 price of $13.70. This means that it had a yield of 63.38%, or an average monthly yield of 1.96%. The peak-to-valley is -40.27%. The capital gains were -31.70%. The overall gain/loss (cap gains + yield) is 31.67%, or a gain/loss per month of 0.98%. The average volume since inception was 30,740.
JPO received a recent dividend of $0.0651 on 5/22/2026. This means the current yield ($0.0651 / $13.70 * weeks/months per year paid) is 24.71%.
[24] YieldMax MSTR Short Option Income Strategy ETF [WNTR]
WNTR had total dividends of $33.3357 from 3/27/2025 to 5/22/2026. It has been active for 13.82 months. During that time frame it had a starting price of $50.06, a high price of $60.64, a low price of $20.85, and a 5/22/2026 price of $23.31. This means that it had a yield of 66.59%, or an average monthly yield of 4.82%. The peak-to-valley is -65.62%. The capital gains were -53.44%. The overall gain/loss (cap gains + yield) is 13.16%, or a gain/loss per month of 0.95%. The average volume since inception was 139,924.
WNTR received a recent dividend of $0.3048 on 5/22/2026. This means the current yield ($0.3048 / $23.31 * weeks/months per year paid) is 67.99%.
[25] YieldMax S&P 500 0DTE Covered Call Strategy ETF [SDTY]
SDTY had total dividends of $14.4583 from 2/6/2025 to 5/22/2026. It has been active for 15.53 months. During that time frame it had a starting price of $50.29, a high price of $51.29, a low price of $38.59, and a 5/22/2026 price of $42.63. This means that it had a yield of 28.75%, or an average monthly yield of 1.85%. The peak-to-valley is -24.76%. The capital gains were -15.23%. The overall gain/loss (cap gains + yield) is 13.52%, or a gain/loss per month of 0.87%. The average volume since inception was 11,115.
SDTY received a recent dividend of $0.2095 on 5/21/2026. This means the current yield ($0.2095 / $42.63 * weeks/months per year paid) is 25.55%.
[26] YieldMax Target 12 Real Estate Option Income ETF [RNTY]
RNTY had total dividends of $6.0641 from 4/17/2025 to 5/22/2026. It has been active for 13.16 months. During that time frame it had a starting price of $50.86, a high price of $53.02, a low price of $47.67, and a 5/22/2026 price of $50.42. This means that it had a yield of 11.92%, or an average monthly yield of 0.91%. The peak-to-valley is -10.09%. The capital gains were -0.87%. The overall gain/loss (cap gains + yield) is 11.06%, or a gain/loss per month of 0.84%. The average volume since inception was 6,554.
RNTY received a recent dividend of $0.5068 on 5/7/2026. This means the current yield ($0.5068 / $50.42 * weeks/months per year paid) is 12.06%.
[27] YieldMax TSLA Performance Distribution Target 25 ETF [TEST]
TEST had total dividends of $5.8256 from 11/18/2025 to 5/22/2026. It has been active for 6.13 months. During that time frame it had a starting price of $49.66, a high price of $57.74, a low price of $40.27, and a 5/22/2026 price of $46.34. This means that it had a yield of 11.73%, or an average monthly yield of 1.91%. The peak-to-valley is -30.26%. The capital gains were -6.69%. The overall gain/loss (cap gains + yield) is 5.05%, or a gain/loss per month of 0.82%. The average volume since inception was 2,029.
TEST received a recent dividend of $0.2217 on 5/20/2026. This means the current yield ($0.2217 / $46.34 * weeks/months per year paid) is 24.88%.
[28] YieldMax AAPL Option Income Strategy ETF [APLY]
APLY had total dividends of $13.5673 from 4/18/2023 to 5/22/2026. It has been active for 37.13 months. During that time frame it had a starting price of $20.20, a high price of $23.02, a low price of $11.36, and a 5/22/2026 price of $12.79. This means that it had a yield of 67.16%, or an average monthly yield of 1.81%. The peak-to-valley is -50.65%. The capital gains were -36.68%. The overall gain/loss (cap gains + yield) is 30.48%, or a gain/loss per month of 0.82%. The average volume since inception was 100,607.
APLY received a recent dividend of $0.1096 on 5/22/2026. This means the current yield ($0.1096 / $12.79 * weeks/months per year paid) is 44.56%.
[29] YieldMax DIS Option Income Strategy ETF [DISO]
DISO had total dividends of $13.7284 from 8/25/2023 to 5/22/2026. It has been active for 32.89 months. During that time frame it had a starting price of $20.16, a high price of $22.69, a low price of $9.53, and a 5/22/2026 price of $9.81. This means that it had a yield of 68.10%, or an average monthly yield of 2.07%. The peak-to-valley is -58.00%. The capital gains were -51.34%. The overall gain/loss (cap gains + yield) is 16.76%, or a gain/loss per month of 0.51%. The average volume since inception was 16,809.
DISO received a recent dividend of $0.0677 on 5/22/2026. This means the current yield ($0.0677 / $9.81 * weeks/months per year paid) is 35.89%.
[30] YieldMax XOM Option Income Strategy ETF [XOMO]
XOMO had total dividends of $10.4702 from 8/31/2023 to 5/22/2026. It has been active for 32.69 months. During that time frame it had a starting price of $20.00, a high price of $23.38, a low price of $11.32, and a 5/22/2026 price of $11.89. This means that it had a yield of 52.35%, or an average monthly yield of 1.60%. The peak-to-valley is -51.58%. The capital gains were -40.55%. The overall gain/loss (cap gains + yield) is 11.80%, or a gain/loss per month of 0.36%. The average volume since inception was 57,196.
XOMO received a recent dividend of $0.1025 on 5/22/2026. This means the current yield ($0.1025 / $11.89 * weeks/months per year paid) is 44.83%.
[31] YieldMax Crypto Industry & Tech Port Opt Inc ETF [LFGY]
LFGY had total dividends of $28.5427 from 1/14/2025 to 5/22/2026. It has been active for 16.26 months. During that time frame it had a starting price of $51.25, a high price of $55.11, a low price of $18.83, and a 5/22/2026 price of $23.67. This means that it had a yield of 55.69%, or an average monthly yield of 3.42%. The peak-to-valley is -65.83%. The capital gains were -53.81%. The overall gain/loss (cap gains + yield) is 1.88%, or a gain/loss per month of 0.12%. The average volume since inception was 127,798.
LFGY received a recent dividend of $0.2541 on 5/21/2026. This means the current yield ($0.2541 / $23.67 * weeks/months per year paid) is 55.82%.
[32] YieldMax BRK B Option Income Strategy ETF [BRKC]
BRKC had total dividends of $7.9519 from 6/5/2025 to 5/22/2026. It has been active for 11.56 months. During that time frame it had a starting price of $49.68, a high price of $50.66, a low price of $40.24, and a 5/22/2026 price of $41.03. This means that it had a yield of 16.01%, or an average monthly yield of 1.38%. The peak-to-valley is -20.57%. The capital gains were -17.41%. The overall gain/loss (cap gains + yield) is -1.41%, or a gain/loss per month of -0.12%. The average volume since inception was 14,622.
BRKC received a recent dividend of $0.1692 on 5/22/2026. This means the current yield ($0.1692 / $41.03 * weeks/months per year paid) is 21.44%.
[33] YieldMax Short N100 Option Income Strategy ETF [YQQQ]
YQQQ had total dividends of $6.4561 from 8/15/2024 to 5/22/2026. It has been active for 21.23 months. During that time frame it had a starting price of $19.64, a high price of $20.55, a low price of $10.21, and a 5/22/2026 price of $10.27. This means that it had a yield of 32.87%, or an average monthly yield of 1.55%. The peak-to-valley is -50.32%. The capital gains were -47.71%. The overall gain/loss (cap gains + yield) is -14.84%, or a gain/loss per month of -0.70%. The average volume since inception was 44,406.
YQQQ received a recent dividend of $0.0434 on 5/22/2026. This means the current yield ($0.0434 / $10.27 * weeks/months per year paid) is 21.97%.
[34] YieldMax Dorsey Wright Hybrid 5 Income ETF [FIVY]
FIVY had total dividends of $17.7652 from 12/17/2024 to 5/22/2026. It has been active for 17.16 months. During that time frame it had a starting price of $49.78, a high price of $52.51, a low price of $22.23, and a 5/22/2026 price of $25.52. This means that it had a yield of 35.69%, or an average monthly yield of 2.08%. The peak-to-valley is -57.67%. The capital gains were -48.73%. The overall gain/loss (cap gains + yield) is -13.05%, or a gain/loss per month of -0.76%. The average volume since inception was 8,960.
FIVY received a recent dividend of $0.2123 on 5/21/2026. This means the current yield ($0.2123 / $25.52 * weeks/months per year paid) is 43.26%.
[35] YieldMax Dorsey Wright Featured 5 Income ETF [FEAT]
FEAT had total dividends of $23.7534 from 12/17/2024 to 5/22/2026. It has been active for 17.16 months. During that time frame it had a starting price of $49.71, a high price of $50.21, a low price of $17.30, and a 5/22/2026 price of $18.92. This means that it had a yield of 47.78%, or an average monthly yield of 2.78%. The peak-to-valley is -65.54%. The capital gains were -61.94%. The overall gain/loss (cap gains + yield) is -14.16%, or a gain/loss per month of -0.82%. The average volume since inception was 23,395.
FEAT received a recent dividend of $0.2553 on 5/21/2026. This means the current yield ($0.2553 / $18.92 * weeks/months per year paid) is 70.17%.
[36] YieldMax GME Option Income Strategy ETF [GMEY]
GMEY had total dividends of $14.5291 from 9/9/2025 to 5/22/2026. It has been active for 8.43 months. During that time frame it had a starting price of $50.43, a high price of $56.15, a low price of $29.36, and a 5/22/2026 price of $30.53. This means that it had a yield of 28.81%, or an average monthly yield of 3.42%. The peak-to-valley is -47.71%. The capital gains were -39.46%. The overall gain/loss (cap gains + yield) is -10.65%, or a gain/loss per month of -1.26%. The average volume since inception was 9,942.
GMEY received a recent dividend of $0.2947 on 5/22/2026. This means the current yield ($0.2947 / $30.53 * weeks/months per year paid) is 50.19%.
[37] YieldMax SMCI Option Income Strategy ETF [SMCY]
SMCY had total dividends of $30.8426 from 9/12/2024 to 5/22/2026. It has been active for 20.33 months. During that time frame it had a starting price of $50.62, a high price of $59.20, a low price of $4.80, and a 5/22/2026 price of $6.57. This means that it had a yield of 60.93%, or an average monthly yield of 3.00%. The peak-to-valley is -91.89%. The capital gains were -87.02%. The overall gain/loss (cap gains + yield) is -26.09%, or a gain/loss per month of -1.28%. The average volume since inception was 786,667.
SMCY received a recent dividend of $0.1045 on 5/22/2026. This means the current yield ($0.1045 / $6.57 * weeks/months per year paid) is 82.71%.
[38] YieldMax Ultra Short Option Income Strategy ETF [SLTY]
SLTY had total dividends of $17.3158 from 8/21/2025 to 5/22/2026. It has been active for 9.03 months. During that time frame it had a starting price of $49.96, a high price of $50.47, a low price of $24.85, and a 5/22/2026 price of $24.85. This means that it had a yield of 34.66%, or an average monthly yield of 3.84%. The peak-to-valley is -50.76%. The capital gains were -50.26%. The overall gain/loss (cap gains + yield) is -15.60%, or a gain/loss per month of -1.73%. The average volume since inception was 40,902.
SLTY received a recent dividend of $0.3221 on 5/21/2026. This means the current yield ($0.3221 / $24.85 * weeks/months per year paid) is 67.40%.
[39] YieldMax MARA Option Income Strategy ETF [MARO]
MARO had total dividends of $23.5124 from 12/10/2024 to 5/22/2026. It has been active for 17.39 months. During that time frame it had a starting price of $47.14, a high price of $53.06, a low price of $5.04, and a 5/22/2026 price of $6.64. This means that it had a yield of 49.88%, or an average monthly yield of 2.87%. The peak-to-valley is -90.50%. The capital gains were -85.91%. The overall gain/loss (cap gains + yield) is -36.04%, or a gain/loss per month of -2.07%. The average volume since inception was 209,076.
MARO received a recent dividend of $0.1171 on 5/22/2026. This means the current yield ($0.1171 / $6.64 * weeks/months per year paid) is 91.70%.
[40] YieldMax CRCL Option Income Strategy ETF [CRCO]
CRCO had total dividends of $16.7847 from 9/30/2025 to 5/22/2026. It has been active for 7.72 months. During that time frame it had a starting price of $49.21, a high price of $57.31, a low price of $15.01, and a 5/22/2026 price of $23.61. This means that it had a yield of 34.11%, or an average monthly yield of 4.42%. The peak-to-valley is -73.81%. The capital gains were -52.02%. The overall gain/loss (cap gains + yield) is -17.91%, or a gain/loss per month of -2.32%. The average volume since inception was 66,538.
CRCO received a recent dividend of $0.4130 on 5/22/2026. This means the current yield ($0.4130 / $23.61 * weeks/months per year paid) is 90.96%.
[41] YieldMax MSTR Performance & Distribution Tg 25 ETF [MSST]
MSST had total dividends of $4.7543 from 11/18/2025 to 5/22/2026. It has been active for 6.13 months. During that time frame it had a starting price of $53.14, a high price of $54.29, a low price of $28.30, and a 5/22/2026 price of $37.83. This means that it had a yield of 8.95%, or an average monthly yield of 1.46%. The peak-to-valley is -47.87%. The capital gains were -28.81%. The overall gain/loss (cap gains + yield) is -19.86%, or a gain/loss per month of -3.24%. The average volume since inception was 2,650.
MSST received a recent dividend of $0.2002 on 5/20/2026. This means the current yield ($0.2002 / $37.83 * weeks/months per year paid) is 27.52%.
[42] YieldMax Strat Metals & Mining Portfolio Opt Inc [MINY]
MINY had total dividends of $3.0109 from 2/27/2026 to 5/22/2026. It has been active for 2.82 months. During that time frame it had a starting price of $50.29, a high price of $51.40, a low price of $38.67, and a 5/22/2026 price of $42.65. This means that it had a yield of 5.99%, or an average monthly yield of 2.12%. The peak-to-valley is -24.77%. The capital gains were -15.19%. The overall gain/loss (cap gains + yield) is -9.20%, or a gain/loss per month of -3.26%. The average volume since inception was 6,789.
MINY received a recent dividend of $0.2549 on 5/21/2026. This means the current yield ($0.2549 / $42.65 * weeks/months per year paid) is 31.08%.
[43] YieldMax DKNG Option Income Strategy ETF [DRAY]
DRAY had total dividends of $14.7942 from 7/15/2025 to 5/22/2026. It has been active for 10.23 months. During that time frame it had a starting price of $50.09, a high price of $53.95, a low price of $15.00, and a 5/22/2026 price of $17.56. This means that it had a yield of 29.54%, or an average monthly yield of 2.89%. The peak-to-valley is -72.20%. The capital gains were -64.94%. The overall gain/loss (cap gains + yield) is -35.41%, or a gain/loss per month of -3.46%. The average volume since inception was 32,890.
DRAY received a recent dividend of $0.2953 on 5/22/2026. This means the current yield ($0.2953 / $17.56 * weeks/months per year paid) is 87.45%.
[44] YieldMax RDDT Option Income Strategy ETF [RDYY]
RDYY had total dividends of $17.2051 from 9/9/2025 to 5/22/2026. It has been active for 8.43 months. During that time frame it had a starting price of $51.29, a high price of $56.57, a low price of $17.99, and a 5/22/2026 price of $18.41. This means that it had a yield of 33.54%, or an average monthly yield of 3.98%. The peak-to-valley is -68.20%. The capital gains were -64.11%. The overall gain/loss (cap gains + yield) is -30.56%, or a gain/loss per month of -3.63%. The average volume since inception was 35,107.
RDYY received a recent dividend of $0.3481 on 5/22/2026. This means the current yield ($0.3481 / $18.41 * weeks/months per year paid) is 98.32%.
[45] YieldMax RBLX Option Income Strategy ETF [RBLY]
RBLY had total dividends of $15.5777 from 7/29/2025 to 5/22/2026. It has been active for 9.76 months. During that time frame it had a starting price of $49.34, a high price of $58.42, a low price of $12.50, and a 5/22/2026 price of $13.73. This means that it had a yield of 31.57%, or an average monthly yield of 3.24%. The peak-to-valley is -78.60%. The capital gains were -72.17%. The overall gain/loss (cap gains + yield) is -40.60%, or a gain/loss per month of -4.16%. The average volume since inception was 18,074.
RBLY received a recent dividend of $0.2336 on 5/22/2026. This means the current yield ($0.2336 / $13.73 * weeks/months per year paid) is 88.47%.
[46] YieldMax HIMS Option Income Strategy ETF [HIYY]
HIYY had total dividends of $12.7772 from 9/23/2025 to 5/22/2026. It has been active for 7.95 months. During that time frame it had a starting price of $48.32, a high price of $53.97, a low price of $9.53, and a 5/22/2026 price of $13.70. This means that it had a yield of 26.44%, or an average monthly yield of 3.32%. The peak-to-valley is -82.34%. The capital gains were -71.65%. The overall gain/loss (cap gains + yield) is -45.20%, or a gain/loss per month of -5.68%. The average volume since inception was 48,277.
HIYY received a recent dividend of $0.2186 on 5/22/2026. This means the current yield ($0.2186 / $13.70 * weeks/months per year paid) is 82.97%.