
YIELDMAX -- Yield + Capital Gain Analysis 4/10/2026
A more realistic view of current yield trends

As always, please read our disclaimer. Important!
If you want to skip right to the data, scroll down to the “Individual Stock Analysis” section below.
Also note that we are currently in the middle of our April run!

Meaning it’s a great time to sign up for a paid subscription!
YieldMax’s Reverse Splits
Last year, YieldMax executed a massive reverse split across 15 of its products.
Rather than rehash the full discussion which we covered in detail here…

…we’ll simply note the practical issue: YieldMax has still not properly reverse-adjusted its dividend reporting — something most firms handle as a matter of course.
As a result, we are again skipping the affected products in this week’s analysis. They will not appear below.
Tickers excluded:
ABNY, AIYY, AMDY, CONY, CRSH, DIPS, FIAT, MRNY, MSTY, OARK, PYPY, TSLY, ULTY, XYZY, YBIT
The Current Yield Conundrum
We recently published a post on NAV erosion that directly addresses reverse-split dynamics in the covered-call ETF space.
No need to repeat it all here — but that post is worth reading:

The core point of the post is simple:
If an ETF pays massive distributions, that money must come from somewhere.
Covered-call ETFs are marketed as generating income from option premiums.
In practice, many also rely heavily on Return of Capital (ROC) — meaning part of the “distribution” is simply your own money being handed back to you to inflate the headline yield.
ROC functions a bit like a reverse mortgage:
You receive steady payments
The underlying asset slowly deteriorates
With a reverse mortgage, everyone understands the bank eventually owns the house.
With covered-call ETFs + ROC, many investors don’t realize the same dynamic can apply: principal can erode while the fund continues mailing out large checks.
Investors see huge yields and assume they’ll keep both:
their original investment
all that income
But if distributions are largely ROC, NAV can fall as fast as — or faster than — payouts.
The result? Eye-popping distributions… and still a negative total return.
Which brings us back to the main takeaway of the post:
Current yield isn’t necessarily what everyone thinks it is.
Do check out the post:
YieldMax General Info
Given the continued popularity of YieldMax, we’re continuing to evaluate all of their products based on a more meaningful metric:
Yield + Capital Gain
Almost all YieldMax funds have now transitioned to a weekly pay model. The only exceptions (for now) are:
BIGY
RNTY
SOXY
Those remain monthly payers.
We are keeping YieldMax separate from the broader weekly-payer universe — because covering 100+ stocks in one post is simply too much.
If you want to see the rest of the weekly payer universe, that is available here:

Analysis Tables
Here is some useful data:
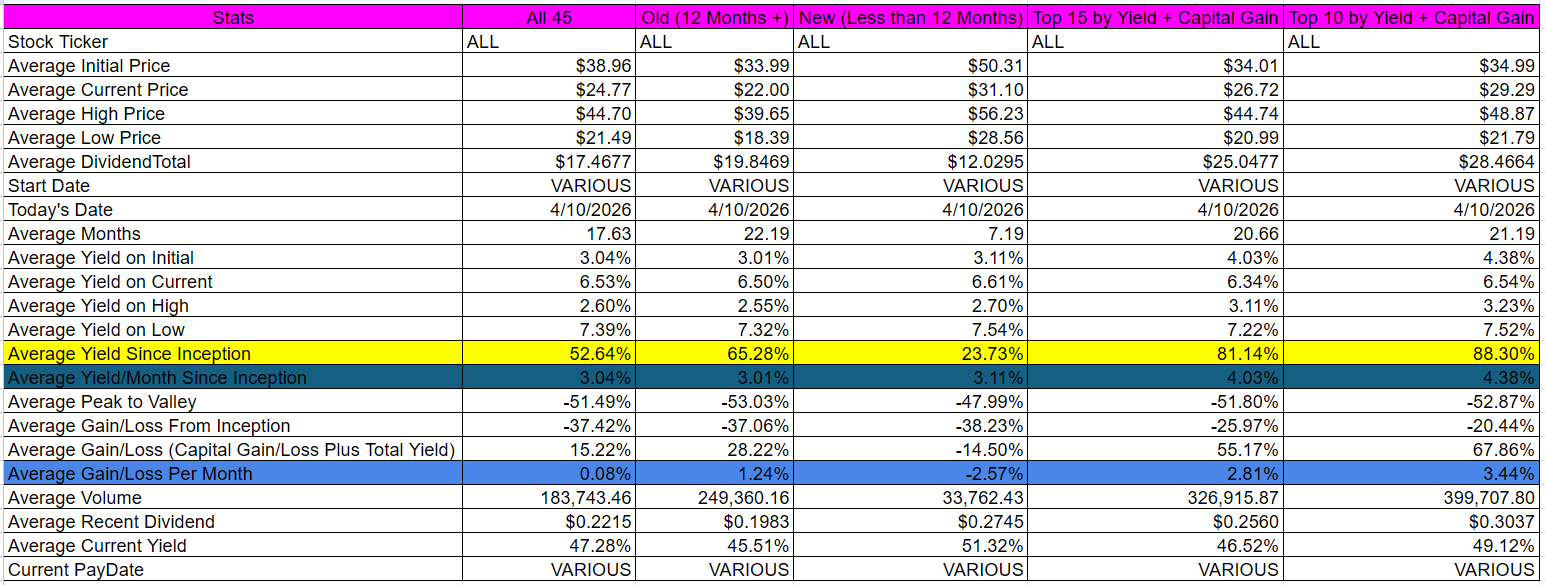
First, an averages table for all YieldMax products covered in this post. The columns in the table below from left-to-right are:
All 46 products
All products with GREATER than 12 months of performance history
All products with LESS than 12 months of performance history
Top 15 by yield + capital gain
Top 10 by yield + capital gain
Second, a Top 15 list by yield + capital gain normalized by months in existence:
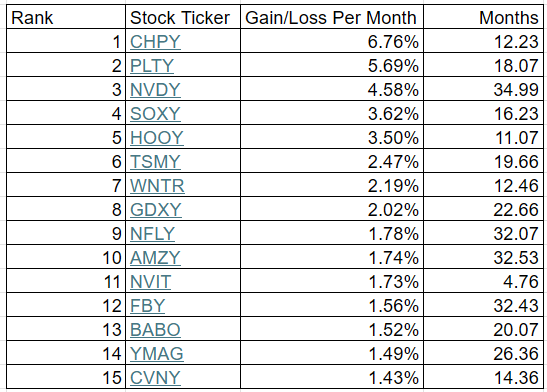
Important notes:
Figures in the Top 15 list are yield + capital gain normalized by months in existence
(Total yield + total capital gain) ÷ months since inception
This is NOT current yield
All data is calculated since inception
These reflect full historical records — not necessarily current trends
Dividends are calculated using the Ex-EFF Date
Support the Work
This is a free post.
If you find this analysis useful and want to see more of what we’re building, consider a paid subscription:
$5/month or $60/year
Also, as we mentioned above:
We are currently in the middle of our April Run: it runs from April 1 through mid-May.
In other words… it’s a great time to sign up for a paid subscription.
Tons of dividend data. Just $5/month:
Individual Stock Analysis (46 Entries)
In the list of individual stocks below, everything is sorted by descending yield + capital gain (bolded in each first paragraph). This is a far more useful metric than current yield alone.
Current yield is still listed — just not prioritized — and is listed in the second paragraph of each entry.
And before jumping headfirst into The River of Current Yield, make sure to read the full first paragraph of each entry.
Fair warning.
Occasionally, we may hold positions in some of these stocks.
[1] YieldMax Semiconductor Portfolio Option Income ETF [CHPY]
CHPY had total dividends of $22.3826 from 4/3/2025 to 4/10/2026. It has been active for 12.23 months. During that time frame it had a starting price of $45.65, a high price of $62.04, a low price of $40.40, and a 4/10/2026 price of $61.01. This means that it had a yield of 49.03%, or an average monthly yield of 4.01%. The peak-to-valley is -34.88%. The capital gains were 33.65%. The overall gain/loss (cap gains + yield) is 82.68%, or a gain/loss per month of 6.76%. The average volume since inception was 118,504.
CHPY received a recent dividend of $0.4406 on 4/9/2026. This means the current yield ($0.4406 / $61.01 * weeks/months per year paid) is 37.55%.
[2] YieldMax PLTR Option Income Strategy ETF [PLTY]
PLTY had total dividends of $70.6219 from 10/8/2024 to 4/10/2026. It has been active for 18.07 months. During that time frame it had a starting price of $51.43, a high price of $95.08, a low price of $32.30, and a 4/10/2026 price of $33.68. This means that it had a yield of 137.32%, or an average monthly yield of 7.60%. The peak-to-valley is -66.03%. The capital gains were -34.51%. The overall gain/loss (cap gains + yield) is 102.80%, or a gain/loss per month of 5.69%. The average volume since inception was 314,730.
PLTY received a recent dividend of $0.4548 on 4/10/2026. This means the current yield ($0.4548 / $33.68 * weeks/months per year paid) is 70.22%.
[3] YieldMax NVDA Option Income Strategy ETF [NVDY]
NVDY had total dividends of $38.3805 from 5/11/2023 to 4/10/2026. It has been active for 34.99 months. During that time frame it had a starting price of $19.91, a high price of $31.77, a low price of $12.34, and a 4/10/2026 price of $13.45. This means that it had a yield of 192.77%, or an average monthly yield of 5.51%. The peak-to-valley is -61.16%. The capital gains were -32.45%. The overall gain/loss (cap gains + yield) is 160.32%, or a gain/loss per month of 4.58%. The average volume since inception was 2,417,883.
NVDY received a recent dividend of $0.1111 on 4/10/2026. This means the current yield ($0.1111 / $13.45 * weeks/months per year paid) is 42.95%.
[4] YieldMax Target 12 Semiconductor Option Inc ETF [SOXY]
SOXY had total dividends of $8.8184 from 12/3/2024 to 4/10/2026. It has been active for 16.23 months. During that time frame it had a starting price of $50.10, a high price of $71.39, a low price of $35.02, and a 4/10/2026 price of $70.68. This means that it had a yield of 17.60%, or an average monthly yield of 1.08%. The peak-to-valley is -50.95%. The capital gains were 41.08%. The overall gain/loss (cap gains + yield) is 58.68%, or a gain/loss per month of 3.62%. The average volume since inception was 6,139.
SOXY received a recent dividend of $0.6541 on 4/9/2026. This means the current yield ($0.6541 / $70.68 * weeks/months per year paid) is 11.11%.
[5] YieldMax HOOD Option Income Strategy ETF [HOOY]
HOOY had total dividends of $45.6656 from 5/8/2025 to 4/10/2026. It has been active for 11.07 months. During that time frame it had a starting price of $52.82, a high price of $80.99, a low price of $25.85, and a 4/10/2026 price of $27.63. This means that it had a yield of 86.46%, or an average monthly yield of 7.81%. The peak-to-valley is -68.08%. The capital gains were -47.69%. The overall gain/loss (cap gains + yield) is 38.76%, or a gain/loss per month of 3.50%. The average volume since inception was 184,359.
HOOY received a recent dividend of $0.4038 on 4/10/2026. This means the current yield ($0.4038 / $27.63 * weeks/months per year paid) is 76.00%.
[6] YieldMax TSM Option Income Strategy ETF [TSMY]
TSMY had total dividends of $13.5215 from 8/21/2024 to 4/10/2026. It has been active for 19.66 months. During that time frame it had a starting price of $20.03, a high price of $22.31, a low price of $12.10, and a 4/10/2026 price of $16.22. This means that it had a yield of 67.51%, or an average monthly yield of 3.43%. The peak-to-valley is -45.76%. The capital gains were -19.02%. The overall gain/loss (cap gains + yield) is 48.48%, or a gain/loss per month of 2.47%. The average volume since inception was 97,440.
TSMY received a recent dividend of $0.1250 on 4/10/2026. This means the current yield ($0.1250 / $16.22 * weeks/months per year paid) is 40.07%.
[7] YieldMax MSTR Short Option Income Strategy ETF [WNTR]
WNTR had total dividends of $31.4405 from 3/27/2025 to 4/10/2026. It has been active for 12.46 months. During that time frame it had a starting price of $50.06, a high price of $60.64, a low price of $27.24, and a 4/10/2026 price of $32.31. This means that it had a yield of 62.81%, or an average monthly yield of 5.04%. The peak-to-valley is -55.08%. The capital gains were -35.46%. The overall gain/loss (cap gains + yield) is 27.35%, or a gain/loss per month of 2.19%. The average volume since inception was 134,826.
WNTR received a recent dividend of $0.5301 on 4/10/2026. This means the current yield ($0.5301 / $32.31 * weeks/months per year paid) is 85.31%.
[8] YieldMax Gold Miners Option Income Strategy ETF [GDXY]
GDXY had total dividends of $14.3733 from 5/21/2024 to 4/10/2026. It has been active for 22.66 months. During that time frame it had a starting price of $19.85, a high price of $19.98, a low price of $12.41, and a 4/10/2026 price of $14.58. This means that it had a yield of 72.41%, or an average monthly yield of 3.20%. The peak-to-valley is -37.89%. The capital gains were -26.55%. The overall gain/loss (cap gains + yield) is 45.86%, or a gain/loss per month of 2.02%. The average volume since inception was 320,083.
GDXY received a recent dividend of $0.1539 on 4/10/2026. This means the current yield ($0.1539 / $14.58 * weeks/months per year paid) is 54.89%.
[9] YieldMax NFLX Option Income Strategy ETF [NFLY]
NFLY had total dividends of $20.1614 from 8/8/2023 to 4/10/2026. It has been active for 32.07 months. During that time frame it had a starting price of $19.99, a high price of $20.36, a low price of $9.60, and a 4/10/2026 price of $11.27. This means that it had a yield of 100.86%, or an average monthly yield of 3.15%. The peak-to-valley is -52.85%. The capital gains were -43.62%. The overall gain/loss (cap gains + yield) is 57.24%, or a gain/loss per month of 1.78%. The average volume since inception was 126,812.
NFLY received a recent dividend of $0.0847 on 4/10/2026. This means the current yield ($0.0847 / $11.27 * weeks/months per year paid) is 39.08%.
[10] YieldMax AMZN Option Income Strategy ETF [AMZY]
AMZY had total dividends of $19.2985 from 7/25/2023 to 4/10/2026. It has been active for 32.53 months. During that time frame it had a starting price of $20.05, a high price of $24.10, a low price of $10.61, and a 4/10/2026 price of $12.07. This means that it had a yield of 96.25%, or an average monthly yield of 2.96%. The peak-to-valley is -55.98%. The capital gains were -39.80%. The overall gain/loss (cap gains + yield) is 56.45%, or a gain/loss per month of 1.74%. The average volume since inception was 276,302.
AMZY received a recent dividend of $0.0790 on 4/10/2026. This means the current yield ($0.0790 / $12.07 * weeks/months per year paid) is 34.03%.
[11] YieldMax NVDA Performance Distribution Target 25 ETF [NVIT]
NVIT had total dividends of $4.4266 from 11/18/2025 to 4/10/2026. It has been active for 4.76 months. During that time frame it had a starting price of $49.25, a high price of $52.27, a low price of $44.20, and a 4/10/2026 price of $48.88. This means that it had a yield of 8.99%, or an average monthly yield of 1.89%. The peak-to-valley is -15.44%. The capital gains were -0.75%. The overall gain/loss (cap gains + yield) is 8.24%, or a gain/loss per month of 1.73%. The average volume since inception was 3,980.
NVIT received a recent dividend of $0.2261 on 4/8/2026. This means the current yield ($0.2261 / $48.88 * weeks/months per year paid) is 24.05%.
[12] YieldMax META Option Income Strategy ETF [FBY]
FBY had total dividends of $20.2636 from 7/28/2023 to 4/10/2026. It has been active for 32.43 months. During that time frame it had a starting price of $20.63, a high price of $24.49, a low price of $9.40, and a 4/10/2026 price of $10.78. This means that it had a yield of 98.22%, or an average monthly yield of 3.03%. The peak-to-valley is -61.62%. The capital gains were -47.75%. The overall gain/loss (cap gains + yield) is 50.48%, or a gain/loss per month of 1.56%. The average volume since inception was 126,289.
FBY received a recent dividend of $0.0714 on 4/10/2026. This means the current yield ($0.0714 / $10.78 * weeks/months per year paid) is 34.44%.
[13] YieldMax BABA Option Income Strategy ETF [BABO]
BABO had total dividends of $16.4097 from 8/8/2024 to 4/10/2026. It has been active for 20.07 months. During that time frame it had a starting price of $20.42, a high price of $25.53, a low price of $9.79, and a 4/10/2026 price of $10.22. This means that it had a yield of 80.36%, or an average monthly yield of 4.00%. The peak-to-valley is -61.65%. The capital gains were -49.95%. The overall gain/loss (cap gains + yield) is 30.41%, or a gain/loss per month of 1.52%. The average volume since inception was 74,715.
BABO received a recent dividend of $0.0913 on 4/10/2026. This means the current yield ($0.0913 / $10.22 * weeks/months per year paid) is 46.45%.
[14] YieldMax Magnificent 7 Fund of Option Income ETFs [YMAG]
YMAG had total dividends of $15.4209 from 1/30/2024 to 4/10/2026. It has been active for 26.36 months. During that time frame it had a starting price of $19.89, a high price of $21.91, a low price of $11.47, and a 4/10/2026 price of $12.29. This means that it had a yield of 77.53%, or an average monthly yield of 2.94%. The peak-to-valley is -47.65%. The capital gains were -38.21%. The overall gain/loss (cap gains + yield) is 39.32%, or a gain/loss per month of 1.49%. The average volume since inception was 638,944.
YMAG received a recent dividend of $0.0807 on 4/9/2026. This means the current yield ($0.0807 / $12.29 * weeks/months per year paid) is 34.14%.
[15] YieldMax CVNA Option Income Strategy ETF [CVNY]
CVNY had total dividends of $34.5305 from 1/30/2025 to 4/10/2026. It has been active for 14.36 months. During that time frame it had a starting price of $50.00, a high price of $58.17, a low price of $22.07, and a 4/10/2026 price of $25.74. This means that it had a yield of 69.06%, or an average monthly yield of 4.81%. The peak-to-valley is -62.06%. The capital gains were -48.52%. The overall gain/loss (cap gains + yield) is 20.54%, or a gain/loss per month of 1.43%. The average volume since inception was 62,732.
CVNY received a recent dividend of $0.3340 on 4/10/2026. This means the current yield ($0.3340 / $25.74 * weeks/months per year paid) is 67.47%.
[16] YieldMax GOOGL Option Income Strategy ETF [GOOY]
GOOY had total dividends of $14.3569 from 7/28/2023 to 4/10/2026. It has been active for 32.43 months. During that time frame it had a starting price of $20.50, a high price of $20.83, a low price of $10.89, and a 4/10/2026 price of $13.53. This means that it had a yield of 70.03%, or an average monthly yield of 2.16%. The peak-to-valley is -47.72%. The capital gains were -34.00%. The overall gain/loss (cap gains + yield) is 36.03%, or a gain/loss per month of 1.11%. The average volume since inception was 167,785.
GOOY received a recent dividend of $0.0854 on 4/10/2026. This means the current yield ($0.0854 / $13.53 * weeks/months per year paid) is 32.82%.
[17] YieldMax JP Option Income Strategy ETF [JPO]
JPO had total dividends of $12.0081 from 9/12/2023 to 4/10/2026. It has been active for 30.95 months. During that time frame it had a starting price of $20.06, a high price of $22.30, a low price of $13.32, and a 4/10/2026 price of $14.38. This means that it had a yield of 59.86%, or an average monthly yield of 1.93%. The peak-to-valley is -40.27%. The capital gains were -28.32%. The overall gain/loss (cap gains + yield) is 31.55%, or a gain/loss per month of 1.02%. The average volume since inception was 31,499.
JPO received a recent dividend of $0.0745 on 4/10/2026. This means the current yield ($0.0745 / $14.38 * weeks/months per year paid) is 26.94%.
[18] YieldMax Russell 2000 0DTE Covered Call Strat ETF [RDTY]
RDTY had total dividends of $18.5897 from 3/6/2025 to 4/10/2026. It has been active for 13.13 months. During that time frame it had a starting price of $49.21, a high price of $50.07, a low price of $35.11, and a 4/10/2026 price of $37.06. This means that it had a yield of 37.78%, or an average monthly yield of 2.88%. The peak-to-valley is -29.88%. The capital gains were -24.69%. The overall gain/loss (cap gains + yield) is 13.09%, or a gain/loss per month of 1.00%. The average volume since inception was 11,470.
RDTY received a recent dividend of $0.3291 on 4/9/2026. This means the current yield ($0.3291 / $37.06 * weeks/months per year paid) is 46.18%.
[19] YieldMax AI & Tech Portfolio Option Income ETF [GPTY]
GPTY had total dividends of $18.1891 from 1/23/2025 to 4/10/2026. It has been active for 14.59 months. During that time frame it had a starting price of $50.09, a high price of $50.43, a low price of $32.92, and a 4/10/2026 price of $38.60. This means that it had a yield of 36.31%, or an average monthly yield of 2.49%. The peak-to-valley is -34.72%. The capital gains were -22.94%. The overall gain/loss (cap gains + yield) is 13.37%, or a gain/loss per month of 0.92%. The average volume since inception was 36,037.
GPTY received a recent dividend of $0.2877 on 4/9/2026. This means the current yield ($0.2877 / $38.60 * weeks/months per year paid) is 38.76%.
[20] YieldMax Target 12 Big 50 Option Income ETF [BIGY]
BIGY had total dividends of $8.0878 from 11/21/2024 to 4/10/2026. It has been active for 16.66 months. During that time frame it had a starting price of $50.15, a high price of $54.64, a low price of $40.00, and a 4/10/2026 price of $49.56. This means that it had a yield of 16.13%, or an average monthly yield of 0.97%. The peak-to-valley is -26.79%. The capital gains were -1.18%. The overall gain/loss (cap gains + yield) is 14.95%, or a gain/loss per month of 0.90%. The average volume since inception was 6,750.
BIGY received a recent dividend of $0.4899 on 4/9/2026. This means the current yield ($0.4899 / $49.56 * weeks/months per year paid) is 11.86%.
[21] YieldMax MSFT Option Income Strategy ETF [MSFO]
MSFO had total dividends of $14.1243 from 8/25/2023 to 4/10/2026. It has been active for 31.53 months. During that time frame it had a starting price of $20.18, a high price of $23.48, a low price of $11.14, and a 4/10/2026 price of $11.48. This means that it had a yield of 69.99%, or an average monthly yield of 2.22%. The peak-to-valley is -52.56%. The capital gains were -43.11%. The overall gain/loss (cap gains + yield) is 26.88%, or a gain/loss per month of 0.85%. The average volume since inception was 70,015.
MSFO received a recent dividend of $0.1115 on 4/10/2026. This means the current yield ($0.1115 / $11.48 * weeks/months per year paid) is 50.51%.
[22] YieldMax SNOW Option Income Strategy ETF [SNOY]
SNOY had total dividends of $17.6125 from 6/11/2024 to 4/10/2026. It has been active for 21.99 months. During that time frame it had a starting price of $20.18, a high price of $23.76, a low price of $6.17, and a 4/10/2026 price of $6.30. This means that it had a yield of 87.28%, or an average monthly yield of 3.97%. The peak-to-valley is -74.03%. The capital gains were -68.78%. The overall gain/loss (cap gains + yield) is 18.50%, or a gain/loss per month of 0.84%. The average volume since inception was 115,715.
SNOY received a recent dividend of $0.0950 on 4/10/2026. This means the current yield ($0.0950 / $6.30 * weeks/months per year paid) is 78.41%.
[23] YieldMax Universe Fund of Option Income ETFs [YMAX]
YMAX had total dividends of $16.4436 from 1/17/2024 to 4/10/2026. It has been active for 26.79 months. During that time frame it had a starting price of $19.90, a high price of $21.94, a low price of $7.47, and a 4/10/2026 price of $7.71. This means that it had a yield of 82.63%, or an average monthly yield of 3.08%. The peak-to-valley is -65.95%. The capital gains were -61.26%. The overall gain/loss (cap gains + yield) is 21.37%, or a gain/loss per month of 0.80%. The average volume since inception was 1,463,709.
YMAX received a recent dividend of $0.0901 on 4/9/2026. This means the current yield ($0.0901 / $7.71 * weeks/months per year paid) is 60.77%.
[24] YieldMax Target 12 Real Estate Option Income ETF [RNTY]
RNTY had total dividends of $5.5573 from 4/17/2025 to 4/10/2026. It has been active for 11.79 months. During that time frame it had a starting price of $50.86, a high price of $53.02, a low price of $47.67, and a 4/10/2026 price of $49.58. This means that it had a yield of 10.93%, or an average monthly yield of 0.93%. The peak-to-valley is -10.09%. The capital gains were -2.52%. The overall gain/loss (cap gains + yield) is 8.41%, or a gain/loss per month of 0.71%. The average volume since inception was 7,407.
RNTY received a recent dividend of $0.4942 on 4/9/2026. This means the current yield ($0.4942 / $49.58 * weeks/months per year paid) is 11.96%.
[25] YieldMax AAPL Option Income Strategy ETF [APLY]
APLY had total dividends of $12.9762 from 4/18/2023 to 4/10/2026. It has been active for 35.76 months. During that time frame it had a starting price of $20.20, a high price of $23.02, a low price of $11.36, and a 4/10/2026 price of $11.78. This means that it had a yield of 64.24%, or an average monthly yield of 1.80%. The peak-to-valley is -50.65%. The capital gains were -41.68%. The overall gain/loss (cap gains + yield) is 22.56%, or a gain/loss per month of 0.63%. The average volume since inception was 99,863.
APLY received a recent dividend of $0.0613 on 4/10/2026. This means the current yield ($0.0613 / $11.78 * weeks/months per year paid) is 27.06%.
[26] YieldMax S&P 500 0DTE Covered Call Strategy ETF [SDTY]
SDTY had total dividends of $13.0794 from 2/6/2025 to 4/10/2026. It has been active for 14.13 months. During that time frame it had a starting price of $50.29, a high price of $51.29, a low price of $38.59, and a 4/10/2026 price of $40.90. This means that it had a yield of 26.01%, or an average monthly yield of 1.84%. The peak-to-valley is -24.76%. The capital gains were -18.67%. The overall gain/loss (cap gains + yield) is 7.34%, or a gain/loss per month of 0.52%. The average volume since inception was 10,811.
SDTY received a recent dividend of $0.2617 on 4/9/2026. This means the current yield ($0.2617 / $40.90 * weeks/months per year paid) is 33.27%.
[27] YieldMax Nasdaq 100 0DTE Covered Call Strategy ETF [QDTY]
QDTY had total dividends of $15.5281 from 2/13/2025 to 4/10/2026. It has been active for 13.92 months. During that time frame it had a starting price of $50.61, a high price of $52.55, a low price of $36.36, and a 4/10/2026 price of $38.69. This means that it had a yield of 30.68%, or an average monthly yield of 2.20%. The peak-to-valley is -30.81%. The capital gains were -23.55%. The overall gain/loss (cap gains + yield) is 7.13%, or a gain/loss per month of 0.51%. The average volume since inception was 11,639.
QDTY received a recent dividend of $0.2801 on 4/9/2026. This means the current yield ($0.2801 / $38.69 * weeks/months per year paid) is 37.65%.
[28] YieldMax DIS Option Income Strategy ETF [DISO]
DISO had total dividends of $13.2992 from 8/25/2023 to 4/10/2026. It has been active for 31.53 months. During that time frame it had a starting price of $20.16, a high price of $22.69, a low price of $9.53, and a 4/10/2026 price of $9.98. This means that it had a yield of 65.97%, or an average monthly yield of 2.09%. The peak-to-valley is -58.00%. The capital gains were -50.50%. The overall gain/loss (cap gains + yield) is 15.47%, or a gain/loss per month of 0.49%. The average volume since inception was 17,469.
DISO received a recent dividend of $0.0604 on 4/10/2026. This means the current yield ($0.0604 / $9.98 * weeks/months per year paid) is 31.47%.
[29] YieldMax XOM Option Income Strategy ETF [XOMO]
XOMO had total dividends of $9.9772 from 8/31/2023 to 4/10/2026. It has been active for 31.33 months. During that time frame it had a starting price of $20.01, a high price of $23.38, a low price of $11.32, and a 4/10/2026 price of $12.41. This means that it had a yield of 49.86%, or an average monthly yield of 1.59%. The peak-to-valley is -51.58%. The capital gains were -37.98%. The overall gain/loss (cap gains + yield) is 11.88%, or a gain/loss per month of 0.38%. The average volume since inception was 53,668.
XOMO received a recent dividend of $0.0879 on 4/10/2026. This means the current yield ($0.0879 / $12.41 * weeks/months per year paid) is 36.83%.
[30] YieldMax BRK B Option Income Strategy ETF [BRKC]
BRKC had total dividends of $7.0870 from 6/5/2025 to 4/10/2026. It has been active for 10.16 months. During that time frame it had a starting price of $49.68, a high price of $50.66, a low price of $40.82, and a 4/10/2026 price of $41.68. This means that it had a yield of 14.27%, or an average monthly yield of 1.40%. The peak-to-valley is -19.42%. The capital gains were -16.10%. The overall gain/loss (cap gains + yield) is -1.84%, or a gain/loss per month of -0.18%. The average volume since inception was 16,621.
BRKC received a recent dividend of $0.1228 on 4/10/2026. This means the current yield ($0.1228 / $41.68 * weeks/months per year paid) is 15.32%.
[31] YieldMax Crypto Industry & Tech Port Opt Inc ETF [LFGY]
LFGY had total dividends of $27.0592 from 1/14/2025 to 4/10/2026. It has been active for 14.89 months. During that time frame it had a starting price of $51.25, a high price of $55.11, a low price of $18.83, and a 4/10/2026 price of $21.43. This means that it had a yield of 52.80%, or an average monthly yield of 3.55%. The peak-to-valley is -65.83%. The capital gains were -58.19%. The overall gain/loss (cap gains + yield) is -5.39%, or a gain/loss per month of -0.36%. The average volume since inception was 135,832.
LFGY received a recent dividend of $0.2203 on 4/9/2026. This means the current yield ($0.2203 / $21.43 * weeks/months per year paid) is 53.46%.
[32] YieldMax Short N100 Option Income Strategy ETF [YQQQ]
YQQQ had total dividends of $6.1494 from 8/15/2024 to 4/10/2026. It has been active for 19.85 months. During that time frame it had a starting price of $19.64, a high price of $20.55, a low price of $11.47, and a 4/10/2026 price of $12.01. This means that it had a yield of 31.31%, or an average monthly yield of 1.58%. The peak-to-valley is -44.18%. The capital gains were -38.85%. The overall gain/loss (cap gains + yield) is -7.54%, or a gain/loss per month of -0.38%. The average volume since inception was 39,956.
YQQQ received a recent dividend of $0.0783 on 4/10/2026. This means the current yield ($0.0783 / $12.01 * weeks/months per year paid) is 33.90%.
[33] YieldMax Dorsey Wright Featured 5 Income ETF [FEAT]
FEAT had total dividends of $22.3611 from 12/17/2024 to 4/10/2026. It has been active for 15.79 months. During that time frame it had a starting price of $49.71, a high price of $50.21, a low price of $17.30, and a 4/10/2026 price of $18.51. This means that it had a yield of 44.98%, or an average monthly yield of 2.85%. The peak-to-valley is -65.54%. The capital gains were -62.76%. The overall gain/loss (cap gains + yield) is -17.78%, or a gain/loss per month of -1.13%. The average volume since inception was 24,404.
FEAT received a recent dividend of $0.1853 on 4/9/2026. This means the current yield ($0.1853 / $18.51 * weeks/months per year paid) is 52.06%.
[34] YieldMax Dorsey Wright Hybrid 5 Income ETF [FIVY]
FIVY had total dividends of $16.6732 from 12/17/2024 to 4/10/2026. It has been active for 15.79 months. During that time frame it had a starting price of $49.78, a high price of $52.51, a low price of $22.23, and a 4/10/2026 price of $24.03. This means that it had a yield of 33.49%, or an average monthly yield of 2.12%. The peak-to-valley is -57.67%. The capital gains were -51.73%. The overall gain/loss (cap gains + yield) is -18.23%, or a gain/loss per month of -1.15%. The average volume since inception was 9,457.
FIVY received a recent dividend of $0.1424 on 4/9/2026. This means the current yield ($0.1424 / $24.03 * weeks/months per year paid) is 30.81%.
[35] YieldMax SMCI Option Income Strategy ETF [SMCY]
SMCY had total dividends of $30.2156 from 9/12/2024 to 4/10/2026. It has been active for 18.95 months. During that time frame it had a starting price of $50.62, a high price of $59.20, a low price of $4.80, and a 4/10/2026 price of $5.67. This means that it had a yield of 59.69%, or an average monthly yield of 3.15%. The peak-to-valley is -91.89%. The capital gains were -88.80%. The overall gain/loss (cap gains + yield) is -29.11%, or a gain/loss per month of -1.54%. The average volume since inception was 763,969.
SMCY received a recent dividend of $0.0838 on 4/10/2026. This means the current yield ($0.0838 / $5.67 * weeks/months per year paid) is 76.85%.
[36] YieldMax Ultra Short Option Income Strategy ETF [SLTY]
SLTY had total dividends of $15.4001 from 8/21/2025 to 4/10/2026. It has been active for 7.66 months. During that time frame it had a starting price of $49.96, a high price of $50.47, a low price of $27.49, and a 4/10/2026 price of $28.62. This means that it had a yield of 30.82%, or an average monthly yield of 4.03%. The peak-to-valley is -45.53%. The capital gains were -42.71%. The overall gain/loss (cap gains + yield) is -11.89%, or a gain/loss per month of -1.55%. The average volume since inception was 43,144.
SLTY received a recent dividend of $0.3678 on 4/9/2026. This means the current yield ($0.3678 / $28.62 * weeks/months per year paid) is 66.83%.
[37] YieldMax GME Option Income Strategy ETF [GMEY]
GMEY had total dividends of $12.5191 from 9/9/2025 to 4/10/2026. It has been active for 7.03 months. During that time frame it had a starting price of $50.43, a high price of $56.15, a low price of $31.73, and a 4/10/2026 price of $32.34. This means that it had a yield of 24.82%, or an average monthly yield of 3.53%. The peak-to-valley is -43.49%. The capital gains were -35.87%. The overall gain/loss (cap gains + yield) is -11.05%, or a gain/loss per month of -1.57%. The average volume since inception was 11,720.
GMEY received a recent dividend of $0.3170 on 4/10/2026. This means the current yield ($0.3170 / $32.34 * weeks/months per year paid) is 50.97%.
[38] YieldMax TSLA Performance Distribution Target 25 ETF [TEST]
TEST had total dividends of $4.5506 from 11/18/2025 to 4/10/2026. It has been active for 4.76 months. During that time frame it had a starting price of $49.66, a high price of $57.74, a low price of $40.27, and a 4/10/2026 price of $41.13. This means that it had a yield of 9.16%, or an average monthly yield of 1.93%. The peak-to-valley is -30.26%. The capital gains were -17.18%. The overall gain/loss (cap gains + yield) is -8.01%, or a gain/loss per month of -1.68%. The average volume since inception was 2,304.
TEST received a recent dividend of $0.2046 on 4/8/2026. This means the current yield ($0.2046 / $41.13 * weeks/months per year paid) is 25.87%.
[39] YieldMax MARA Option Income Strategy ETF [MARO]
MARO had total dividends of $22.7476 from 12/10/2024 to 4/10/2026. It has been active for 16 months. During that time frame it had a starting price of $47.14, a high price of $53.06, a low price of $5.04, and a 4/10/2026 price of $5.75. This means that it had a yield of 48.26%, or an average monthly yield of 3.02%. The peak-to-valley is -90.50%. The capital gains were -87.80%. The overall gain/loss (cap gains + yield) is -39.55%, or a gain/loss per month of -2.47%. The average volume since inception was 194,078.
MARO received a recent dividend of $0.1095 on 4/10/2026. This means the current yield ($0.1095 / $5.75 * weeks/months per year paid) is 99.03%.
[40] YieldMax RBLX Option Income Strategy ETF [RBLY]
RBLY had total dividends of $14.6020 from 7/29/2025 to 4/10/2026. It has been active for 8.39 months. During that time frame it had a starting price of $49.34, a high price of $58.42, a low price of $16.58, and a 4/10/2026 price of $17.23. This means that it had a yield of 29.59%, or an average monthly yield of 3.53%. The peak-to-valley is -71.62%. The capital gains were -65.08%. The overall gain/loss (cap gains + yield) is -35.48%, or a gain/loss per month of -4.23%. The average volume since inception was 20,617.
RBLY received a recent dividend of $0.1871 on 4/10/2026. This means the current yield ($0.1871 / $17.23 * weeks/months per year paid) is 56.47%.
[41] YieldMax RDDT Option Income Strategy ETF [RDYY]
RDYY had total dividends of $14.7701 from 9/9/2025 to 4/10/2026. It has been active for 7.03 months. During that time frame it had a starting price of $51.29, a high price of $56.57, a low price of $17.99, and a 4/10/2026 price of $20.14. This means that it had a yield of 28.80%, or an average monthly yield of 4.09%. The peak-to-valley is -68.20%. The capital gains were -60.73%. The overall gain/loss (cap gains + yield) is -31.94%, or a gain/loss per month of -4.54%. The average volume since inception was 36,023.
RDYY received a recent dividend of $0.2988 on 4/10/2026. This means the current yield ($0.2988 / $20.14 * weeks/months per year paid) is 77.15%.
[42] YieldMax CRCL Option Income Strategy ETF [CRCO]
CRCO had total dividends of $14.4173 from 9/30/2025 to 4/10/2026. It has been active for 6.36 months. During that time frame it had a starting price of $49.21, a high price of $57.31, a low price of $15.01, and a 4/10/2026 price of $20.34. This means that it had a yield of 29.30%, or an average monthly yield of 4.61%. The peak-to-valley is -73.81%. The capital gains were -58.67%. The overall gain/loss (cap gains + yield) is -29.37%, or a gain/loss per month of -4.62%. The average volume since inception was 71,322.
CRCO received a recent dividend of $0.3567 on 4/10/2026. This means the current yield ($0.3567 / $20.34 * weeks/months per year paid) is 91.19%.
[43] YieldMax DKNG Option Income Strategy ETF [DRAY]
DRAY had total dividends of $13.4743 from 7/15/2025 to 4/10/2026. It has been active for 8.85 months. During that time frame it had a starting price of $50.09, a high price of $53.95, a low price of $15.68, and a 4/10/2026 price of $16.12. This means that it had a yield of 26.90%, or an average monthly yield of 3.04%. The peak-to-valley is -70.94%. The capital gains were -67.82%. The overall gain/loss (cap gains + yield) is -40.92%, or a gain/loss per month of -4.62%. The average volume since inception was 17,421.
DRAY received a recent dividend of $0.1616 on 4/10/2026. This means the current yield ($0.1616 / $16.12 * weeks/months per year paid) is 52.13%.
[44] YieldMax Strat Metals & Mining Portfolio Opt Inc [MINY]
MINY had total dividends of $1.4176 from 2/27/2026 to 4/10/2026. It has been active for 1.46 months. During that time frame it had a starting price of $50.29, a high price of $51.40, a low price of $38.67, and a 4/10/2026 price of $45.21. This means that it had a yield of 2.82%, or an average monthly yield of 1.93%. The peak-to-valley is -24.77%. The capital gains were -10.10%. The overall gain/loss (cap gains + yield) is -7.28%, or a gain/loss per month of -4.99%. The average volume since inception was 6,686.
MINY received a recent dividend of $0.2541 on 4/9/2026. This means the current yield ($0.2541 / $45.21 * weeks/months per year paid) is 29.23%.
[45] YieldMax MSTR Performance & Distribution Tg 25 ETF [MSST]
MSST had total dividends of $3.5879 from 11/18/2025 to 4/10/2026. It has been active for 4.76 months. During that time frame it had a starting price of $53.14, a high price of $54.29, a low price of $28.30, and a 4/10/2026 price of $33.42. This means that it had a yield of 6.75%, or an average monthly yield of 1.42%. The peak-to-valley is -47.87%. The capital gains were -37.11%. The overall gain/loss (cap gains + yield) is -30.36%, or a gain/loss per month of -6.38%. The average volume since inception was 2,764.
MSST received a recent dividend of $0.1514 on 4/8/2026. This means the current yield ($0.1514 / $33.42 * weeks/months per year paid) is 23.56%.
[46] YieldMax HIMS Option Income Strategy ETF [HIYY]
HIYY had total dividends of $10.9368 from 9/23/2025 to 4/10/2026. It has been active for 6.59 months. During that time frame it had a starting price of $48.32, a high price of $53.97, a low price of $9.53, and a 4/10/2026 price of $13.09. This means that it had a yield of 22.63%, or an average monthly yield of 3.43%. The peak-to-valley is -82.34%. The capital gains were -72.91%. The overall gain/loss (cap gains + yield) is -50.28%, or a gain/loss per month of -7.63%. The average volume since inception was 48,306.
HIYY received a recent dividend of $0.2966 on 4/10/2026. This means the current yield ($0.2966 / $13.09 * weeks/months per year paid) is 117.82%.