
YIELDMAX -- Yield + Capital Gain Analysis 11/28/2025
A more realistic view of current yield trends

As always, please read our disclaimer. Important!
YieldMax’s Upcoming Reverse Splits
Well, this week is YieldMax’s last week before a massive reverse split across 15 of its products:
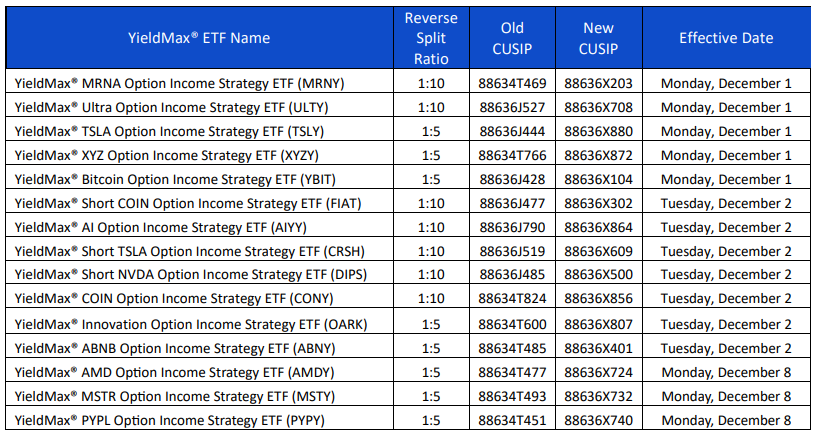
So that is… not good. A reverse split basically means that the NAVS of these funds have become low enough they are starting to run into exchange listing requirements and tradability issues.
Reverse splits of this kind (due to sustained capital losses) are never great for the firm that has to do them.
The Current Yield Conundrum
But it is kind of interesting that we just did a post on NAV erosion which speaks directly to this issue in the “covered call ETF” space:

The basic underlying argument is — that if you are going to have massive distributions, the money has to come from somewhere.
With covered-call ETFs, the understanding is that option premium income is going to pay for the majority of those distributions.
In reality, a lot of firms also engage in “return of capital” meaning that they distribute option premium (income) and interest, but also just give some of your money back to pump up the distribution numbers.
In practice, “return of capital” is a bit like a reverse mortgage.
In a reverse mortgage, you take a mortgage out on your fully-paid off house, and the bank pays you money each month until the bank actually owns the house.
A reverse mortgage gives you steady income while at the same time the asset (your house) basically erodes away underneath you until there is nothing left.
Same principle here.
In a reverse mortgage, most folks understand what they are getting into — and that eventually their house will be owned entirely by the bank.
With some covered-call ETFs, however, I’m not sure that all investors actually understand what is going on.
Investors see the huge distribution number, do the math, and think that at the end of the year they will end up with a) their original investment (or better) plus b) whatever the current yield is — and current yields sometimes top 80%.
Except a lot of an ETF’s distribution might be “return of capital.”
A fact which might be stated in all of the fund’s literature… but “return of capital” might not be that well understood by the average investor.
The result is sometimes NAV erosion which is equal to, or greater than, the distributions — which means you make an investment, get huge distributions, but still lose money.
Anyways, that’s all covered in this post…
…so we don’t really need to belabor the point any further other than to say — “current yield isn’t exactly what you think it would be.”
YieldMax General Info
Given the popularity of YieldMax we thought we would continue our analysis of all of their products from the standpoint of “yield + capital gain.”
As mentioned last week, YieldMax has transitioned almost all of their products to a weekly-pay model — meaning you get paid a distribution once a week for all YieldMax products except BIGY, RNTY, and SOXY (those are still monthly-payers for the moment).
We will be keeping YieldMax separate from the other weekly payers, because 100 stocks is just way too many to cover in one post.
Though we did do that 10 days ago if you want to see how all weekly payers stack up together.

Arguably, 57 is also too much here — but that’s what we do best — all of it!
We won’t do our usual “yield + capital gain” discussion this week — we did all of that in a longer post which covers all of that same material…
…so just consider the content of that post quoted here in its entirety.
Analysis Tables
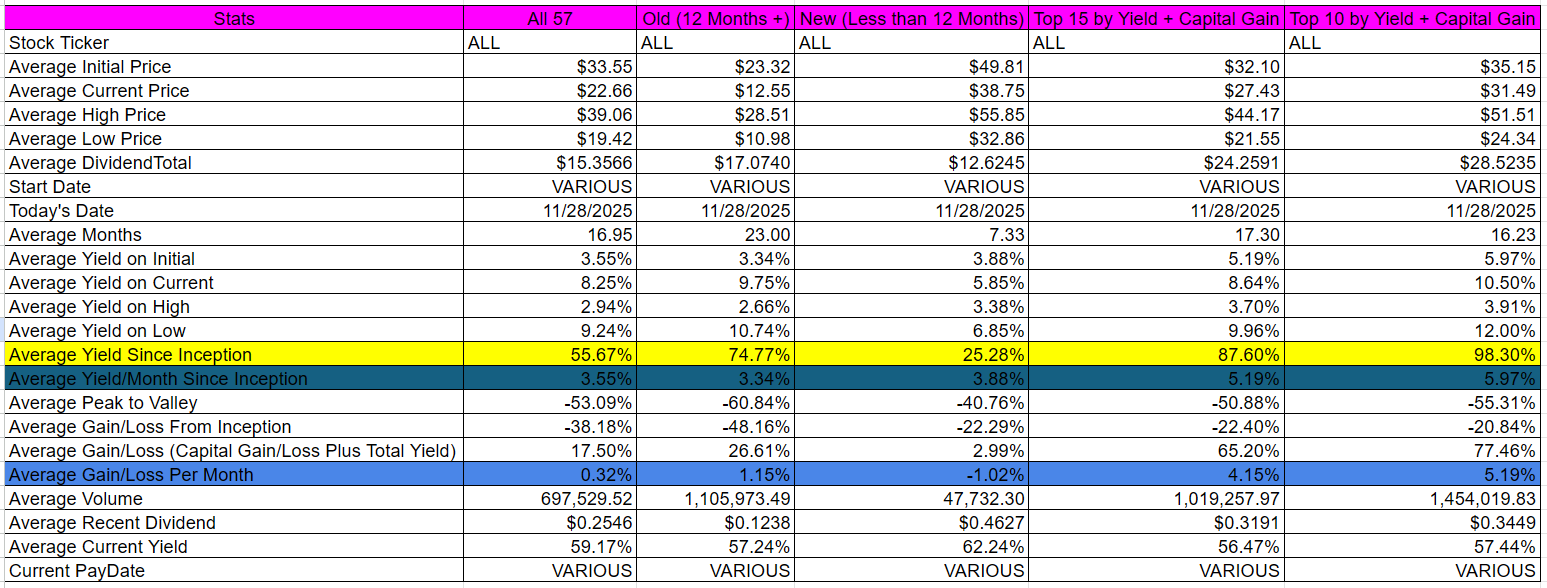
Here is a summary of all YieldMax products which you might find useful, including Top 10 and Top 15 by “yield + capital gain” sections (the right two columns).
And then here are the top 15 by “yield + capital gain” — but normalized by months in existence.
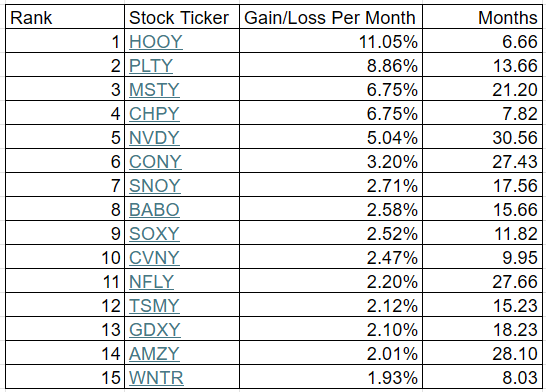
Please note these performance figures are “yield + capital gain” normalized by month (total yield + total capital gain / months in existence). This is NOT current yield.
Also note that these are “since inception” numbers which reflect the ENTIRE historical record of an ETF — not necessarily current trends.
You will notice that some of the most popular YieldMax products — like ULTY — don’t even make it into this Top 15 list.
For all of the entries below, do make sure to look at the full picture (the first paragraph of each entry) before riding the rapids of “The River of Current Yield.”
Current yield is still listed (second paragraph of each entry), but that is out of order.
Here everything is sorted by descending “yield + capital gain” (in bold in each first paragraph of each entry). A far more useful metric.
Occasionally we may hold positions in some of these stocks.
All dividends are calculated based on the “Ex-EFF Date.”
This is a free post! To see what else we’re up to, and to support our work, please consider a paid subscription. Only $5/month or $60/year!
Individual Stock Analysis (57 Entries)
[1] YieldMax HOOD Option Income Strategy ETF [HOOY]
HOOY had total dividends of $36.1515 from 5/8/2025 to 11/28/2025. It has been active for 6.66 months. During that time frame it had a starting price of $52.82, a high price of $80.99, a low price of $47.06, and a 11/28/2025 price of $55.51. This means that it had a yield of 68.44%, or an average monthly yield of 10.28%. The peak-to-valley* is -41.89%. The capital gains were 5.09%. The overall gain/loss (cap gains + yield) is 73.54%, or a gain/loss per month of 11.05%. The average volume since inception was 202,231.
HOOY received a recent dividend of $0.7381 on 12/1/2025. This means the current yield ($0.7381 / $55.51 * weeks/months per year paid) is 69.14%.
*For a description of how Dividend Farmer calculates “peak-to-valley” please see the FAQ.
[2] YieldMax PLTR Option Income Strategy ETF [PLTY]
PLTY had total dividends of $60.2197 from 10/8/2024 to 11/28/2025. It has been active for 13.66 months. During that time frame it had a starting price of $51.43, a high price of $95.08, a low price of $46.28, and a 11/28/2025 price of $53.45. This means that it had a yield of 117.09%, or an average monthly yield of 8.57%. The peak-to-valley is -51.33%. The capital gains were 3.93%. The overall gain/loss (cap gains + yield) is 121.02%, or a gain/loss per month of 8.86%. The average volume since inception was 327,256.
PLTY received a recent dividend of $0.5916 on 12/1/2025. This means the current yield ($0.5916 / $53.45 * weeks/months per year paid) is 57.56%.
[3] YieldMax MSTR Option Income Strategy ETF [MSTY]
MSTY had total dividends of $44.5162 from 2/22/2024 to 11/28/2025. It has been active for 21.2 months. During that time frame it had a starting price of $21.19, a high price of $46.50, a low price of $6.66, and a 11/28/2025 price of $7.00. This means that it had a yield of 210.08%, or an average monthly yield of 9.91%. The peak-to-valley is -85.68%. The capital gains were -66.97%. The overall gain/loss (cap gains + yield) is 143.12%, or a gain/loss per month of 6.75%. The average volume since inception was 5,267,532.
MSTY received a recent dividend of $0.1352 on 12/1/2025. This means the current yield ($0.1352 / $7.00 * weeks/months per year paid) is 100.43%.
[4] YieldMax Semiconductor Portfolio Option Income ETF [CHPY]
CHPY had total dividends of $13.5866 from 4/3/2025 to 11/28/2025. It has been active for 7.82 months. During that time frame it had a starting price of $45.65, a high price of $60.21, a low price of $40.40, and a 11/28/2025 price of $56.17. This means that it had a yield of 29.76%, or an average monthly yield of 3.81%. The peak-to-valley is -32.90%. The capital gains were 23.04%. The overall gain/loss (cap gains + yield) is 52.81%, or a gain/loss per month of 6.75%. The average volume since inception was 45,067.
CHPY received a recent dividend of $0.4394 on 11/28/2025. This means the current yield ($0.4394 / $56.17 * weeks/months per year paid) is 40.68%.
[5] YieldMax NVDA Option Income Strategy ETF [NVDY]
NVDY had total dividends of $36.1733 from 5/11/2023 to 11/28/2025. It has been active for 30.56 months. During that time frame it had a starting price of $19.91, a high price of $31.77, a low price of $12.47, and a 11/28/2025 price of $14.38. This means that it had a yield of 181.68%, or an average monthly yield of 5.95%. The peak-to-valley is -60.75%. The capital gains were -27.77%. The overall gain/loss (cap gains + yield) is 153.91%, or a gain/loss per month of 5.04%. The average volume since inception was 2,004,019.
NVDY received a recent dividend of $0.1632 on 12/1/2025. This means the current yield ($0.1632 / $14.38 * weeks/months per year paid) is 59.02%.
[6] YieldMax COIN Option Income Strategy ETF [CONY]
CONY had total dividends of $32.3511 from 8/15/2023 to 11/28/2025. It has been active for 27.43 months. During that time frame it had a starting price of $19.77, a high price of $30.18, a low price of $4.25, and a 11/28/2025 price of $4.78. This means that it had a yield of 163.64%, or an average monthly yield of 5.97%. The peak-to-valley is -85.92%. The capital gains were -75.82%. The overall gain/loss (cap gains + yield) is 87.82%, or a gain/loss per month of 3.20%. The average volume since inception was 6,433,559.
CONY received a recent dividend of $0.0656 on 12/1/2025. This means the current yield ($0.0656 / $4.78 * weeks/months per year paid) is 71.36%.
[7] YieldMax SNOW Option Income Strategy ETF [SNOY]
SNOY had total dividends of $15.7049 from 6/11/2024 to 11/28/2025. It has been active for 17.56 months. During that time frame it had a starting price of $20.18, a high price of $23.76, a low price of $12.77, and a 11/28/2025 price of $14.06. This means that it had a yield of 77.82%, or an average monthly yield of 4.43%. The peak-to-valley is -46.25%. The capital gains were -30.33%. The overall gain/loss (cap gains + yield) is 47.50%, or a gain/loss per month of 2.71%. The average volume since inception was 114,464.
SNOY received a recent dividend of $0.1454 on 12/1/2025. This means the current yield ($0.1454 / $14.06 * weeks/months per year paid) is 53.78%.
[8] YieldMax BABA Option Income Strategy ETF [BABO]
BABO had total dividends of $14.3050 from 8/8/2024 to 11/28/2025. It has been active for 15.66 months. During that time frame it had a starting price of $20.42, a high price of $25.53, a low price of $13.62, and a 11/28/2025 price of $14.37. This means that it had a yield of 70.05%, or an average monthly yield of 4.47%. The peak-to-valley is -46.65%. The capital gains were -29.63%. The overall gain/loss (cap gains + yield) is 40.43%, or a gain/loss per month of 2.58%. The average volume since inception was 76,255.
BABO received a recent dividend of $0.1383 on 12/1/2025. This means the current yield ($0.1383 / $14.37 * weeks/months per year paid) is 50.05%.
[9] YieldMax Target 12 Semiconductor Option Inc ETF [SOXY]
SOXY had total dividends of $5.6199 from 12/3/2024 to 11/28/2025. It has been active for 11.82 months. During that time frame it had a starting price of $50.10, a high price of $62.95, a low price of $35.02, and a 11/28/2025 price of $59.43. This means that it had a yield of 11.22%, or an average monthly yield of 0.95%. The peak-to-valley is -44.37%. The capital gains were 18.62%. The overall gain/loss (cap gains + yield) is 29.84%, or a gain/loss per month of 2.52%. The average volume since inception was 4,054.
SOXY received a recent dividend of $0.6210 on 11/6/2025. This means the current yield ($0.6210 / $59.43 * weeks/months per year paid) is 12.54%.
[10] YieldMax CVNA Option Income Strategy ETF [CVNY]
CVNY had total dividends of $26.6063 from 1/30/2025 to 11/28/2025. It has been active for 9.95 months. During that time frame it had a starting price of $50.00, a high price of $58.17, a low price of $24.83, and a 11/28/2025 price of $35.70. This means that it had a yield of 53.21%, or an average monthly yield of 5.35%. The peak-to-valley is -57.31%. The capital gains were -28.60%. The overall gain/loss (cap gains + yield) is 24.61%, or a gain/loss per month of 2.47%. The average volume since inception was 65,760.
CVNY received a recent dividend of $0.4111 on 12/1/2025. This means the current yield ($0.4111 / $35.70 * weeks/months per year paid) is 59.88%.
[11] YieldMax NFLX Option Income Strategy ETF [NFLY]
NFLY had total dividends of $18.2657 from 8/8/2023 to 11/28/2025. It has been active for 27.66 months. During that time frame it had a starting price of $19.99, a high price of $20.36, a low price of $13.47, and a 11/28/2025 price of $13.90. This means that it had a yield of 91.37%, or an average monthly yield of 3.30%. The peak-to-valley is -33.84%. The capital gains were -30.47%. The overall gain/loss (cap gains + yield) is 60.91%, or a gain/loss per month of 2.20%. The average volume since inception was 129,828.
NFLY received a recent dividend of $0.0954 on 12/1/2025. This means the current yield ($0.0954 / $13.90 * weeks/months per year paid) is 35.69%.
[12] YieldMax TSM Option Income Strategy ETF [TSMY]
TSMY had total dividends of $10.9046 from 8/21/2024 to 11/28/2025. It has been active for 15.23 months. During that time frame it had a starting price of $20.03, a high price of $22.31, a low price of $12.10, and a 11/28/2025 price of $15.59. This means that it had a yield of 54.44%, or an average monthly yield of 3.57%. The peak-to-valley is -45.76%. The capital gains were -22.17%. The overall gain/loss (cap gains + yield) is 32.27%, or a gain/loss per month of 2.12%. The average volume since inception was 79,270.
TSMY received a recent dividend of $0.1078 on 12/1/2025. This means the current yield ($0.1078 / $15.59 * weeks/months per year paid) is 35.96%.
[13] YieldMax Gold Miners Option Income Strategy ETF [GDXY]
GDXY had total dividends of $11.0056 from 5/21/2024 to 11/28/2025. It has been active for 18.23 months. During that time frame it had a starting price of $19.85, a high price of $19.98, a low price of $14.18, and a 11/28/2025 price of $16.46. This means that it had a yield of 55.44%, or an average monthly yield of 3.04%. The peak-to-valley is -29.03%. The capital gains were -17.08%. The overall gain/loss (cap gains + yield) is 38.37%, or a gain/loss per month of 2.10%. The average volume since inception was 202,850.
GDXY received a recent dividend of $0.1245 on 12/1/2025. This means the current yield ($0.1245 / $16.46 * weeks/months per year paid) is 39.33%.
[14] YieldMax AMZN Option Income Strategy ETF [AMZY]
AMZY had total dividends of $17.6770 from 7/25/2023 to 11/28/2025. It has been active for 28.1 months. During that time frame it had a starting price of $20.05, a high price of $24.10, a low price of $12.90, and a 11/28/2025 price of $13.67. This means that it had a yield of 88.16%, or an average monthly yield of 3.14%. The peak-to-valley is -46.47%. The capital gains were -31.82%. The overall gain/loss (cap gains + yield) is 56.34%, or a gain/loss per month of 2.01%. The average volume since inception was 247,356.
AMZY received a recent dividend of $0.0829 on 12/1/2025. This means the current yield ($0.0829 / $13.67 * weeks/months per year paid) is 31.53%.
[15] YieldMax MSTR Short Option Income Strategy ETF [WNTR]
WNTR had total dividends of $20.7989 from 3/27/2025 to 11/28/2025. It has been active for 8.03 months. During that time frame it had a starting price of $50.06, a high price of $60.64, a low price of $27.24, and a 11/28/2025 price of $37.02. This means that it had a yield of 41.55%, or an average monthly yield of 5.17%. The peak-to-valley is -55.08%. The capital gains were -26.05%. The overall gain/loss (cap gains + yield) is 15.50%, or a gain/loss per month of 1.93%. The average volume since inception was 89,366.
WNTR received a recent dividend of $0.9263 on 12/1/2025. This means the current yield ($0.9263 / $37.02 * weeks/months per year paid) is 130.11%.
[16] YieldMax Magnificent 7 Fund of Option Income ETFs [YMAG]
YMAG had total dividends of $13.6680 from 1/30/2024 to 11/28/2025. It has been active for 21.95 months. During that time frame it had a starting price of $19.89, a high price of $21.91, a low price of $12.85, and a 11/28/2025 price of $14.64. This means that it had a yield of 68.72%, or an average monthly yield of 3.13%. The peak-to-valley is -41.35%. The capital gains were -26.40%. The overall gain/loss (cap gains + yield) is 42.32%, or a gain/loss per month of 1.93%. The average volume since inception was 546,451.
YMAG received a recent dividend of $0.1227 on 11/28/2025. This means the current yield ($0.1227 / $14.64 * weeks/months per year paid) is 43.58%.
[17] YieldMax META Option Income Strategy ETF [FBY]
FBY had total dividends of $18.5582 from 7/28/2023 to 11/28/2025. It has been active for 28 months. During that time frame it had a starting price of $20.63, a high price of $24.49, a low price of $12.10, and a 11/28/2025 price of $13.02. This means that it had a yield of 89.96%, or an average monthly yield of 3.21%. The peak-to-valley is -50.59%. The capital gains were -36.89%. The overall gain/loss (cap gains + yield) is 53.07%, or a gain/loss per month of 1.90%. The average volume since inception was 140,327.
FBY received a recent dividend of $0.0880 on 12/1/2025. This means the current yield ($0.0880 / $13.02 * weeks/months per year paid) is 35.15%.
[18] YieldMax MSFT Option Income Strategy ETF [MSFO]
MSFO had total dividends of $12.6895 from 8/25/2023 to 11/28/2025. It has been active for 27.1 months. During that time frame it had a starting price of $20.18, a high price of $23.48, a low price of $14.30, and a 11/28/2025 price of $15.97. This means that it had a yield of 62.88%, or an average monthly yield of 2.32%. The peak-to-valley is -39.10%. The capital gains were -20.86%. The overall gain/loss (cap gains + yield) is 42.02%, or a gain/loss per month of 1.55%. The average volume since inception was 61,701.
MSFO received a recent dividend of $0.0787 on 12/1/2025. This means the current yield ($0.0787 / $15.97 * weeks/months per year paid) is 25.63%.
[19] YieldMax AI & Tech Portfolio Option Income ETF [GPTY]
GPTY had total dividends of $13.1483 from 1/23/2025 to 11/28/2025. It has been active for 10.16 months. During that time frame it had a starting price of $50.09, a high price of $50.43, a low price of $32.92, and a 11/28/2025 price of $44.27. This means that it had a yield of 26.25%, or an average monthly yield of 2.58%. The peak-to-valley is -34.72%. The capital gains were -11.62%. The overall gain/loss (cap gains + yield) is 14.63%, or a gain/loss per month of 1.44%. The average volume since inception was 37,377.
GPTY received a recent dividend of $0.3501 on 11/28/2025. This means the current yield ($0.3501 / $44.27 * weeks/months per year paid) is 41.12%.
[20] YieldMax Target 12 Big 50 Option Income ETF [BIGY]
BIGY had total dividends of $5.4948 from 11/21/2024 to 11/28/2025. It has been active for 12.23 months. During that time frame it had a starting price of $50.15, a high price of $54.64, a low price of $40.00, and a 11/28/2025 price of $53.44. This means that it had a yield of 10.96%, or an average monthly yield of 0.90%. The peak-to-valley is -26.79%. The capital gains were 6.56%. The overall gain/loss (cap gains + yield) is 17.52%, or a gain/loss per month of 1.43%. The average volume since inception was 5,049.
BIGY received a recent dividend of $0.5415 on 11/6/2025. This means the current yield ($0.5415 / $53.44 * weeks/months per year paid) is 12.16%.
[21] YieldMax XYZ Option Income Strategy ETF [XYZY]
XYZY had total dividends of $20.0548 from 10/11/2023 to 11/28/2025. It has been active for 25.56 months. During that time frame it had a starting price of $20.19, a high price of $26.70, a low price of $6.53, and a 11/28/2025 price of $7.22. This means that it had a yield of 99.33%, or an average monthly yield of 3.89%. The peak-to-valley is -75.54%. The capital gains were -64.24%. The overall gain/loss (cap gains + yield) is 35.09%, or a gain/loss per month of 1.37%. The average volume since inception was 91,069.
XYZY received a recent dividend of $0.0980 on 12/1/2025. This means the current yield ($0.0980 / $7.22 * weeks/months per year paid) is 70.58%.
[22] YieldMax GOOGL Option Income Strategy ETF [GOOY]
GOOY had total dividends of $12.4126 from 7/28/2023 to 11/28/2025. It has been active for 28 months. During that time frame it had a starting price of $20.50, a high price of $20.83, a low price of $10.89, and a 11/28/2025 price of $15.39. This means that it had a yield of 60.55%, or an average monthly yield of 2.16%. The peak-to-valley is -47.72%. The capital gains were -24.93%. The overall gain/loss (cap gains + yield) is 35.62%, or a gain/loss per month of 1.27%. The average volume since inception was 142,119.
GOOY received a recent dividend of $0.2278 on 12/1/2025. This means the current yield ($0.2278 / $15.39 * weeks/months per year paid) is 76.97%.
[23] YieldMax Universe Fund of Option Income ETFs [YMAX]
YMAX had total dividends of $14.8112 from 1/17/2024 to 11/28/2025. It has been active for 22.36 months. During that time frame it had a starting price of $19.90, a high price of $21.94, a low price of $10.01, and a 11/28/2025 price of $10.69. This means that it had a yield of 74.43%, or an average monthly yield of 3.33%. The peak-to-valley is -54.38%. The capital gains were -46.28%. The overall gain/loss (cap gains + yield) is 28.15%, or a gain/loss per month of 1.26%. The average volume since inception was 1,318,022.
YMAX received a recent dividend of $0.1012 on 11/28/2025. This means the current yield ($0.1012 / $10.69 * weeks/months per year paid) is 49.23%.
[24] YieldMax JPM Option Income Strategy ETF [JPMO]
JPMO had total dividends of $10.5868 from 9/12/2023 to 11/28/2025. It has been active for 26.53 months. During that time frame it had a starting price of $20.06, a high price of $22.30, a low price of $13.64, and a 11/28/2025 price of $16.07. This means that it had a yield of 52.78%, or an average monthly yield of 1.99%. The peak-to-valley is -38.83%. The capital gains were -19.89%. The overall gain/loss (cap gains + yield) is 32.89%, or a gain/loss per month of 1.24%. The average volume since inception was 27,770.
JPMO received a recent dividend of $0.0807 on 12/1/2025. This means the current yield ($0.0807 / $16.07 * weeks/months per year paid) is 26.11%.
[25] YieldMax AMD Option Income Strategy ETF [AMDY]
AMDY had total dividends of $18.4362 from 9/19/2023 to 11/28/2025. It has been active for 26.3 months. During that time frame it had a starting price of $20.00, a high price of $24.28, a low price of $5.83, and a 11/28/2025 price of $7.92. This means that it had a yield of 92.18%, or an average monthly yield of 3.51%. The peak-to-valley is -75.99%. The capital gains were -60.40%. The overall gain/loss (cap gains + yield) is 31.78%, or a gain/loss per month of 1.21%. The average volume since inception was 541,106.
AMDY received a recent dividend of $0.1097 on 12/1/2025. This means the current yield ($0.1097 / $7.92 * weeks/months per year paid) is 72.03%.
[26] YieldMax Russell 2000 0DTE Covered Call Strat ETF [RDTY]
RDTY had total dividends of $12.8269 from 3/6/2025 to 11/28/2025. It has been active for 8.72 months. During that time frame it had a starting price of $49.21, a high price of $50.07, a low price of $39.24, and a 11/28/2025 price of $40.91. This means that it had a yield of 26.07%, or an average monthly yield of 2.99%. The peak-to-valley is -21.63%. The capital gains were -16.87%. The overall gain/loss (cap gains + yield) is 9.20%, or a gain/loss per month of 1.05%. The average volume since inception was 7,264.
RDTY received a recent dividend of $0.4893 on 11/28/2025. This means the current yield ($0.4893 / $40.91 * weeks/months per year paid) is 62.19%.
[27] YieldMax AAPL Option Income Strategy ETF [APLY]
APLY had total dividends of $11.7173 from 4/18/2023 to 11/28/2025. It has been active for 31.33 months. During that time frame it had a starting price of $20.20, a high price of $23.02, a low price of $11.72, and a 11/28/2025 price of $13.90. This means that it had a yield of 58.01%, or an average monthly yield of 1.85%. The peak-to-valley is -49.09%. The capital gains were -31.19%. The overall gain/loss (cap gains + yield) is 26.82%, or a gain/loss per month of 0.86%. The average volume since inception was 86,839.
APLY received a recent dividend of $0.0663 on 12/1/2025. This means the current yield ($0.0663 / $13.90 * weeks/months per year paid) is 24.80%.
[28] YieldMax Nasdaq 100 0DTE Covered Call Strategy ETF [QDTY]
QDTY had total dividends of $10.1718 from 2/13/2025 to 11/28/2025. It has been active for 9.49 months. During that time frame it had a starting price of $50.61, a high price of $52.55, a low price of $36.76, and a 11/28/2025 price of $44.32. This means that it had a yield of 20.10%, or an average monthly yield of 2.12%. The peak-to-valley is -30.05%. The capital gains were -12.43%. The overall gain/loss (cap gains + yield) is 7.67%, or a gain/loss per month of 0.81%. The average volume since inception was 10,170.
QDTY received a recent dividend of $0.4191 on 11/28/2025. This means the current yield ($0.4191 / $44.32 * weeks/months per year paid) is 49.17%.
[29] YieldMax S&P 500 0DTE Covered Call Strategy ETF [SDTY]
SDTY had total dividends of $8.7279 from 2/6/2025 to 11/28/2025. It has been active for 9.72 months. During that time frame it had a starting price of $50.29, a high price of $51.29, a low price of $38.59, and a 11/28/2025 price of $45.21. This means that it had a yield of 17.36%, or an average monthly yield of 1.78%. The peak-to-valley is -24.76%. The capital gains were -10.10%. The overall gain/loss (cap gains + yield) is 7.25%, or a gain/loss per month of 0.75%. The average volume since inception was 10,911.
SDTY received a recent dividend of $0.3370 on 11/28/2025. This means the current yield ($0.3370 / $45.21 * weeks/months per year paid) is 38.76%.
[30] YieldMax PYPL Option Income Strategy ETF [PYPY]
PYPY had total dividends of $14.8547 from 9/26/2023 to 11/28/2025. It has been active for 26.07 months. During that time frame it had a starting price of $20.02, a high price of $21.15, a low price of $8.42, and a 11/28/2025 price of $8.81. This means that it had a yield of 74.20%, or an average monthly yield of 2.85%. The peak-to-valley is -60.19%. The capital gains were -55.99%. The overall gain/loss (cap gains + yield) is 18.21%, or a gain/loss per month of 0.70%. The average volume since inception was 49,679.
PYPY received a recent dividend of $0.0714 on 12/1/2025. This means the current yield ($0.0714 / $8.81 * weeks/months per year paid) is 42.14%.
[31] YieldMax DIS Option Income Strategy ETF [DISO]
DISO had total dividends of $12.0151 from 8/25/2023 to 11/28/2025. It has been active for 27.1 months. During that time frame it had a starting price of $20.16, a high price of $22.69, a low price of $11.45, and a 11/28/2025 price of $11.60. This means that it had a yield of 59.60%, or an average monthly yield of 2.20%. The peak-to-valley is -49.54%. The capital gains were -42.46%. The overall gain/loss (cap gains + yield) is 17.14%, or a gain/loss per month of 0.63%. The average volume since inception was 16,064.
DISO received a recent dividend of $0.0937 on 12/1/2025. This means the current yield ($0.0937 / $11.60 * weeks/months per year paid) is 42.00%.
[32] YieldMax Target 12 Real Estate Option Income ETF [RNTY]
RNTY had total dividends of $3.0555 from 4/17/2025 to 11/28/2025. It has been active for 7.36 months. During that time frame it had a starting price of $50.86, a high price of $53.02, a low price of $48.72, and a 11/28/2025 price of $50.04. This means that it had a yield of 6.01%, or an average monthly yield of 0.82%. The peak-to-valley is -8.11%. The capital gains were -1.61%. The overall gain/loss (cap gains + yield) is 4.40%, or a gain/loss per month of 0.60%. The average volume since inception was 1,668.
RNTY received a recent dividend of $0.4963 on 11/6/2025. This means the current yield ($0.4963 / $50.04 * weeks/months per year paid) is 11.90%.
[33] YieldMax Innovation Option Income Strategy ETF [OARK]
OARK had total dividends of $15.5975 from 11/23/2022 to 11/28/2025. It has been active for 36.16 months. During that time frame it had a starting price of $20.02, a high price of $21.26, a low price of $6.34, and a 11/28/2025 price of $7.58. This means that it had a yield of 77.91%, or an average monthly yield of 2.15%. The peak-to-valley is -70.18%. The capital gains were -62.14%. The overall gain/loss (cap gains + yield) is 15.77%, or a gain/loss per month of 0.44%. The average volume since inception was 120,202.
OARK received a recent dividend of $0.0733 on 12/1/2025. This means the current yield ($0.0733 / $7.58 * weeks/months per year paid) is 50.28%.
[34] YieldMax BRK B Option Income Strategy ETF [BRKC]
BRKC had total dividends of $4.2095 from 6/5/2025 to 11/28/2025. It has been active for 5.76 months. During that time frame it had a starting price of $49.68, a high price of $50.66, a low price of $45.28, and a 11/28/2025 price of $46.71. This means that it had a yield of 8.47%, or an average monthly yield of 1.47%. The peak-to-valley is -10.62%. The capital gains were -5.98%. The overall gain/loss (cap gains + yield) is 2.49%, or a gain/loss per month of 0.43%. The average volume since inception was 13,452.
BRKC received a recent dividend of $0.1672 on 12/1/2025. This means the current yield ($0.1672 / $46.71 * weeks/months per year paid) is 18.61%.
[35] YieldMax XOM Option Income Strategy ETF [XOMO]
XOMO had total dividends of $8.3535 from 8/31/2023 to 11/28/2025. It has been active for 26.92 months. During that time frame it had a starting price of $20.01, a high price of $23.38, a low price of $11.42, and a 11/28/2025 price of $11.56. This means that it had a yield of 41.75%, or an average monthly yield of 1.55%. The peak-to-valley is -51.15%. The capital gains were -42.23%. The overall gain/loss (cap gains + yield) is -0.48%, or a gain/loss per month of -0.02%. The average volume since inception was 40,667.
XOMO received a recent dividend of $0.0503 on 12/1/2025. This means the current yield ($0.0503 / $11.56 * weeks/months per year paid) is 22.63%.
[36] YieldMax Bitcoin Option Income Strategy ETF [YBIT]
YBIT had total dividends of $13.0730 from 4/23/2024 to 11/28/2025. It has been active for 19.16 months. During that time frame it had a starting price of $20.45, a high price of $23.62, a low price of $6.66, and a 11/28/2025 price of $7.19. This means that it had a yield of 63.93%, or an average monthly yield of 3.34%. The peak-to-valley is -71.80%. The capital gains were -64.84%. The overall gain/loss (cap gains + yield) is -0.91%, or a gain/loss per month of -0.05%. The average volume since inception was 278,157.
YBIT received a recent dividend of $0.0695 on 12/1/2025. This means the current yield ($0.0695 / $7.19 * weeks/months per year paid) is 50.26%.
[37] YieldMax Ultra Option Income Strategy ETF [ULTY]
ULTY had total dividends of $15.0887 from 2/29/2024 to 11/28/2025. It has been active for 20.99 months. During that time frame it had a starting price of $19.35, a high price of $20.55, a low price of $3.88, and a 11/28/2025 price of $4.03. This means that it had a yield of 77.98%, or an average monthly yield of 3.72%. The peak-to-valley is -81.12%. The capital gains were -79.17%. The overall gain/loss (cap gains + yield) is -1.20%, or a gain/loss per month of -0.06%. The average volume since inception was 10,013,382.
ULTY received a recent dividend of $0.0594 on 11/28/2025. This means the current yield ($0.0594 / $4.03 * weeks/months per year paid) is 76.65%.
[38] YieldMax Crypto Industry & Tech Port Opt Inc ETF [LFGY]
LFGY had total dividends of $22.1799 from 1/14/2025 to 11/28/2025. It has been active for 10.46 months. During that time frame it had a starting price of $51.25, a high price of $55.11, a low price of $25.63, and a 11/28/2025 price of $28.60. This means that it had a yield of 43.28%, or an average monthly yield of 4.14%. The peak-to-valley is -53.49%. The capital gains were -44.20%. The overall gain/loss (cap gains + yield) is -0.92%, or a gain/loss per month of -0.09%. The average volume since inception was 149,435.
LFGY received a recent dividend of $0.3673 on 11/28/2025. This means the current yield ($0.3673 / $28.60 * weeks/months per year paid) is 66.78%.
[39] YieldMax TSLA Option Income Strategy ETF [TSLY]
TSLY had total dividends of $26.2708 from 11/23/2022 to 11/28/2025. It has been active for 36.16 months. During that time frame it had a starting price of $40.08, a high price of $43.53, a low price of $6.90, and a 11/28/2025 price of $7.71. This means that it had a yield of 65.55%, or an average monthly yield of 1.81%. The peak-to-valley is -84.15%. The capital gains were -80.76%. The overall gain/loss (cap gains + yield) is -15.22%, or a gain/loss per month of -0.42%. The average volume since inception was 7,039,427.
TSLY received a recent dividend of $0.0956 on 12/1/2025. This means the current yield ($0.0956 / $7.71 * weeks/months per year paid) is 64.48%.
[40] YieldMax Dorsey Wright Hybrid 5 Income ETF [FIVY]
FIVY had total dividends of $12.9824 from 12/17/2024 to 11/28/2025. It has been active for 11.36 months. During that time frame it had a starting price of $49.78, a high price of $52.51, a low price of $29.34, and a 11/28/2025 price of $32.50. This means that it had a yield of 26.08%, or an average monthly yield of 2.30%. The peak-to-valley is -44.12%. The capital gains were -34.71%. The overall gain/loss (cap gains + yield) is -8.63%, or a gain/loss per month of -0.76%. The average volume since inception was 10,509.
FIVY received a recent dividend of $0.2571 on 11/28/2025. This means the current yield ($0.2571 / $32.50 * weeks/months per year paid) is 41.14%.
[41] YieldMax Short N100 Option Income Strategy ETF [YQQQ]
YQQQ had total dividends of $5.0225 from 8/15/2024 to 11/28/2025. It has been active for 15.43 months. During that time frame it had a starting price of $19.64, a high price of $20.55, a low price of $12.10, and a 11/28/2025 price of $12.13. This means that it had a yield of 25.57%, or an average monthly yield of 1.66%. The peak-to-valley is -41.12%. The capital gains were -38.24%. The overall gain/loss (cap gains + yield) is -12.67%, or a gain/loss per month of -0.82%. The average volume since inception was 35,094.
YQQQ received a recent dividend of $0.1139 on 12/1/2025. This means the current yield ($0.1139 / $12.13 * weeks/months per year paid) is 48.83%.
[42] YieldMax Dorsey Wright Featured 5 Income ETF [FEAT]
FEAT had total dividends of $17.3993 from 12/17/2024 to 11/28/2025. It has been active for 11.36 months. During that time frame it had a starting price of $49.71, a high price of $50.21, a low price of $24.88, and a 11/28/2025 price of $27.15. This means that it had a yield of 35.00%, or an average monthly yield of 3.08%. The peak-to-valley is -50.45%. The capital gains were -45.38%. The overall gain/loss (cap gains + yield) is -10.38%, or a gain/loss per month of -0.91%. The average volume since inception was 25,430.
FEAT received a recent dividend of $0.3726 on 11/28/2025. This means the current yield ($0.3726 / $27.15 * weeks/months per year paid) is 71.36%.
[43] YieldMax ABNB Option Income Strategy ETF [ABNY]
ABNY had total dividends of $8.0443 from 6/25/2024 to 11/28/2025. It has been active for 17.1 months. During that time frame it had a starting price of $20.24, a high price of $21.49, a low price of $8.54, and a 11/28/2025 price of $8.79. This means that it had a yield of 39.74%, or an average monthly yield of 2.32%. The peak-to-valley is -60.26%. The capital gains were -56.57%. The overall gain/loss (cap gains + yield) is -16.83%, or a gain/loss per month of -0.98%. The average volume since inception was 18,323.
ABNY received a recent dividend of $0.0913 on 12/1/2025. This means the current yield ($0.0913 / $8.79 * weeks/months per year paid) is 54.01%.
[44] YieldMax MRNA Option Income Strategy ETF [MRNY]
MRNY had total dividends of $11.8354 from 10/24/2023 to 11/28/2025. It has been active for 25.13 months. During that time frame it had a starting price of $20.14, a high price of $26.00, a low price of $1.36, and a 11/28/2025 price of $1.51. This means that it had a yield of 58.77%, or an average monthly yield of 2.34%. The peak-to-valley is -94.77%. The capital gains were -92.50%. The overall gain/loss (cap gains + yield) is -33.74%, or a gain/loss per month of -1.34%. The average volume since inception was 954,878.
MRNY received a recent dividend of $0.0232 on 12/1/2025. This means the current yield ($0.0232 / $1.51 * weeks/months per year paid) is 79.89%.
[45] YieldMax AI Option Income Strategy ETF [AIYY]
AIYY had total dividends of $11.2011 from 11/28/2023 to 11/28/2025. It has been active for 24 months. During that time frame it had a starting price of $20.16, a high price of $21.69, a low price of $1.77, and a 11/28/2025 price of $1.93. This means that it had a yield of 55.56%, or an average monthly yield of 2.32%. The peak-to-valley is -91.84%. The capital gains were -90.43%. The overall gain/loss (cap gains + yield) is -34.87%, or a gain/loss per month of -1.45%. The average volume since inception was 670,899.
AIYY received a recent dividend of $0.0271 on 12/1/2025. This means the current yield ($0.0271 / $1.93 * weeks/months per year paid) is 73.02%.
[46] YieldMax SMCI Option Income Strategy ETF [SMCY]
SMCY had total dividends of $28.0917 from 9/12/2024 to 11/28/2025. It has been active for 14.53 months. During that time frame it had a starting price of $50.62, a high price of $59.20, a low price of $8.88, and a 11/28/2025 price of $9.51. This means that it had a yield of 55.50%, or an average monthly yield of 3.82%. The peak-to-valley is -85.00%. The capital gains were -81.21%. The overall gain/loss (cap gains + yield) is -25.72%, or a gain/loss per month of -1.77%. The average volume since inception was 555,333.
SMCY received a recent dividend of $0.1619 on 12/1/2025. This means the current yield ($0.1619 / $9.51 * weeks/months per year paid) is 88.53%.
[47] YieldMax Short COIN Option Income Strategy ETF [FIAT]
FIAT had total dividends of $11.4530 from 7/10/2024 to 11/28/2025. It has been active for 16.59 months. During that time frame it had a starting price of $20.01, a high price of $23.17, a low price of $2.28, and a 11/28/2025 price of $2.54. This means that it had a yield of 57.24%, or an average monthly yield of 3.45%. The peak-to-valley is -90.16%. The capital gains were -87.31%. The overall gain/loss (cap gains + yield) is -30.07%, or a gain/loss per month of -1.81%. The average volume since inception was 727,311.
FIAT received a recent dividend of $0.0685 on 12/1/2025. This means the current yield ($0.0685 / $2.54 * weeks/months per year paid) is 140.24%.
[48] YieldMax Short TSLA Option Income Strategy ETF [CRSH]
CRSH had total dividends of $9.2820 from 5/2/2024 to 11/28/2025. It has been active for 18.85 months. During that time frame it had a starting price of $20.09, a high price of $22.06, a low price of $2.74, and a 11/28/2025 price of $2.79. This means that it had a yield of 46.20%, or an average monthly yield of 2.45%. The peak-to-valley is -87.58%. The capital gains were -86.11%. The overall gain/loss (cap gains + yield) is -39.91%, or a gain/loss per month of -2.12%. The average volume since inception was 279,780.
CRSH received a recent dividend of $0.0451 on 12/1/2025. This means the current yield ($0.0451 / $2.79 * weeks/months per year paid) is 84.06%.
[49] YieldMax Short NVDA Option Income Strategy ETF [DIPS]
DIPS had total dividends of $7.8530 from 7/24/2024 to 11/28/2025. It has been active for 16.13 months. During that time frame it had a starting price of $20.69, a high price of $24.26, a low price of $4.98, and a 11/28/2025 price of $5.59. This means that it had a yield of 37.96%, or an average monthly yield of 2.35%. The peak-to-valley is -79.47%. The capital gains were -72.98%. The overall gain/loss (cap gains + yield) is -35.03%, or a gain/loss per month of -2.17%. The average volume since inception was 67,032.
DIPS received a recent dividend of $0.1241 on 12/1/2025. This means the current yield ($0.1241 / $5.59 * weeks/months per year paid) is 115.44%.
[50] YieldMax GME Option Income Strategy ETF [GMEY]
GMEY had total dividends of $5.3743 from 9/9/2025 to 11/28/2025. It has been active for 2.62 months. During that time frame it had a starting price of $50.43, a high price of $56.15, a low price of $39.15, and a 11/28/2025 price of $41.86. This means that it had a yield of 10.66%, or an average monthly yield of 4.06%. The peak-to-valley is -30.28%. The capital gains were -16.99%. The overall gain/loss (cap gains + yield) is -6.34%, or a gain/loss per month of -2.41%. The average volume since inception was 17,484.
GMEY received a recent dividend of $0.5104 on 12/1/2025. This means the current yield ($0.5104 / $41.86 * weeks/months per year paid) is 63.40%.
[51] YieldMax RBLX Option Income Strategy ETF [RBLY]
RBLY had total dividends of $9.0916 from 7/29/2025 to 11/28/2025. It has been active for 3.99 months. During that time frame it had a starting price of $49.34, a high price of $58.42, a low price of $32.76, and a 11/28/2025 price of $34.74. This means that it had a yield of 18.43%, or an average monthly yield of 4.62%. The peak-to-valley is -43.92%. The capital gains were -29.59%. The overall gain/loss (cap gains + yield) is -11.16%, or a gain/loss per month of -2.80%. The average volume since inception was 16,212.
RBLY received a recent dividend of $0.3941 on 12/1/2025. This means the current yield ($0.3941 / $34.74 * weeks/months per year paid) is 58.99%.
[52] YieldMax MARA Option Income Strategy ETF [MARO]
MARO had total dividends of $20.5214 from 12/10/2024 to 11/28/2025. It has been active for 11.59 months. During that time frame it had a starting price of $47.14, a high price of $53.06, a low price of $8.67, and a 11/28/2025 price of $10.08. This means that it had a yield of 43.53%, or an average monthly yield of 3.76%. The peak-to-valley is -83.66%. The capital gains were -78.62%. The overall gain/loss (cap gains + yield) is -35.08%, or a gain/loss per month of -3.03%. The average volume since inception was 171,231.
MARO received a recent dividend of $0.1904 on 12/1/2025. This means the current yield ($0.1904 / $10.08 * weeks/months per year paid) is 98.22%.
[53] YieldMax Ultra Short Option Income Strategy ETF [SLTY]
SLTY had total dividends of $7.8419 from 8/21/2025 to 11/28/2025. It has been active for 3.23 months. During that time frame it had a starting price of $49.96, a high price of $50.47, a low price of $36.15, and a 11/28/2025 price of $36.21. This means that it had a yield of 15.70%, or an average monthly yield of 4.86%. The peak-to-valley is -28.37%. The capital gains were -27.52%. The overall gain/loss (cap gains + yield) is -11.83%, or a gain/loss per month of -3.66%. The average volume since inception was 55,586.
SLTY received a recent dividend of $0.5740 on 11/28/2025. This means the current yield ($0.5740 / $36.21 * weeks/months per year paid) is 82.43%.
[54] YieldMax DKNG Option Income Strategy ETF [DRAY]
DRAY had total dividends of $8.2564 from 7/15/2025 to 11/28/2025. It has been active for 4.43 months. During that time frame it had a starting price of $50.09, a high price of $53.95, a low price of $27.56, and a 11/28/2025 price of $32.06. This means that it had a yield of 16.48%, or an average monthly yield of 3.72%. The peak-to-valley is -48.92%. The capital gains were -36.00%. The overall gain/loss (cap gains + yield) is -19.51%, or a gain/loss per month of -4.41%. The average volume since inception was 15,578.
DRAY received a recent dividend of $0.5577 on 12/1/2025. This means the current yield ($0.5577 / $32.06 * weeks/months per year paid) is 90.46%.
[55] YieldMax RDDT Option Income Strategy ETF [RDYY]
RDYY had total dividends of $6.4429 from 9/9/2025 to 11/28/2025. It has been active for 2.62 months. During that time frame it had a starting price of $51.29, a high price of $56.57, a low price of $34.17, and a 11/28/2025 price of $38.44. This means that it had a yield of 12.56%, or an average monthly yield of 4.79%. The peak-to-valley is -39.60%. The capital gains were -25.05%. The overall gain/loss (cap gains + yield) is -12.49%, or a gain/loss per month of -4.76%. The average volume since inception was 24,707.
RDYY received a recent dividend of $0.5800 on 12/1/2025. This means the current yield ($0.5800 / $38.44 * weeks/months per year paid) is 78.46%.
[56] YieldMax HIMS Option Income Strategy ETF [HIYY]
HIYY had total dividends of $5.8620 from 9/23/2025 to 11/28/2025. It has been active for 2.16 months. During that time frame it had a starting price of $48.32, a high price of $53.97, a low price of $26.70, and a 11/28/2025 price of $30.15. This means that it had a yield of 12.13%, or an average monthly yield of 5.61%. The peak-to-valley is -50.53%. The capital gains were -37.60%. The overall gain/loss (cap gains + yield) is -25.47%, or a gain/loss per month of -11.77%. The average volume since inception was 25,188.
HIYY received a recent dividend of $0.5222 on 12/1/2025. This means the current yield ($0.5222 / $30.15 * weeks/months per year paid) is 90.06%.
[57] YieldMax CRCL Option Income Strategy ETF [CRCO]
CRCO had total dividends of $6.8837 from 9/30/2025 to 11/28/2025. It has been active for 1.95 months. During that time frame it had a starting price of $49.21, a high price of $57.31, a low price of $21.84, and a 11/28/2025 price of $25.43. This means that it had a yield of 13.99%, or an average monthly yield of 7.16%. The peak-to-valley is -61.89%. The capital gains were -48.32%. The overall gain/loss (cap gains + yield) is -34.34%, or a gain/loss per month of -17.58%. The average volume since inception was 51,431.
CRCO received a recent dividend of $0.4591 on 12/1/2025. This means the current yield ($0.4591 / $25.43 * weeks/months per year paid) is 93.88%.