
YIELDMAX -- Yield + Capital Gain Analysis 1/16/2026
A more realistic view of current yield trends

As always, please read our disclaimer. Important!
YieldMax’s Reverse Splits
We explained previously that YieldMax recently did a massive reverse split across 15 of its products.
It’s not worth repeating all of that as a more in-depth discussion can be found here:

YieldMax has yet to properly reverse-adjust their dividend reporting (something which most companies do as a matter of course) which means that unfortunately again this week we are going to skip all 15 of those affected products. They will not appear in the analysis below.
The tickers we are skipping are:
ABNY, AIYY, AMDY, CONY, CRSH, DIPS, FIAT, MRNY, MSTY, OARK, PYPY, TSLY, ULTY, XYZY, YBIT.
The Current Yield Conundrum
We did a post recently on NAV erosion which speaks directly to reverse-split issues in the “covered call ETF” space…

…and it’s not really worth repeating all of that here either.
But that article is worth taking the time to read because it makes a simple core point: if an ETF pays massive distributions, that money has to come from somewhere.
Covered‑call ETFs are marketed as generating payouts from option premiums.
But in practice, many funds also rely heavily on Return of Capital (ROC) — meaning part of the “distribution” is just your own money being handed back to you to make the yield look bigger.
Return of Capital in practice works a lot like a reverse mortgage: you receive steady payments, but the underlying asset slowly deteriorates.
With a reverse mortgage, it is generally understood that the bank will eventually own the house.
But for covered‑call ETFs in combination with ROC, many investors don’t realize the same dynamic applies — their principal can erode underneath them while the fund is sending out big checks.
Investors see huge yields and assume at the end of the year they will have not only their original investment but all of that income as well. But if much of the payout is ROC, the fund’s NAV may fall as fast as (or faster than) distributions. The result of which is that you can get paid eye‑popping distributions… and still lose money overall.
Again, that’s all covered in this post…
…so we don’t really need to belabor the point any further other than to say — “current yield isn’t exactly what you think it would be.”
YieldMax General Info
Given the popularity of YieldMax we thought we would continue our analysis of all of their products from the standpoint of “yield + capital gain.”
As mentioned last week, YieldMax has transitioned almost all of their products to a weekly-pay model — meaning you get paid a distribution once a week for all YieldMax products except BIGY, RNTY, and SOXY (those are still monthly-payers for the moment).
We will be keeping YieldMax separate from the other weekly payers, because 100+ stocks is just way too many to cover in one post.
Analysis Tables
Here is a summary of all YieldMax products which you might find useful, including Top 10 and Top 15 by “yield + capital gain” sections (the right two columns).
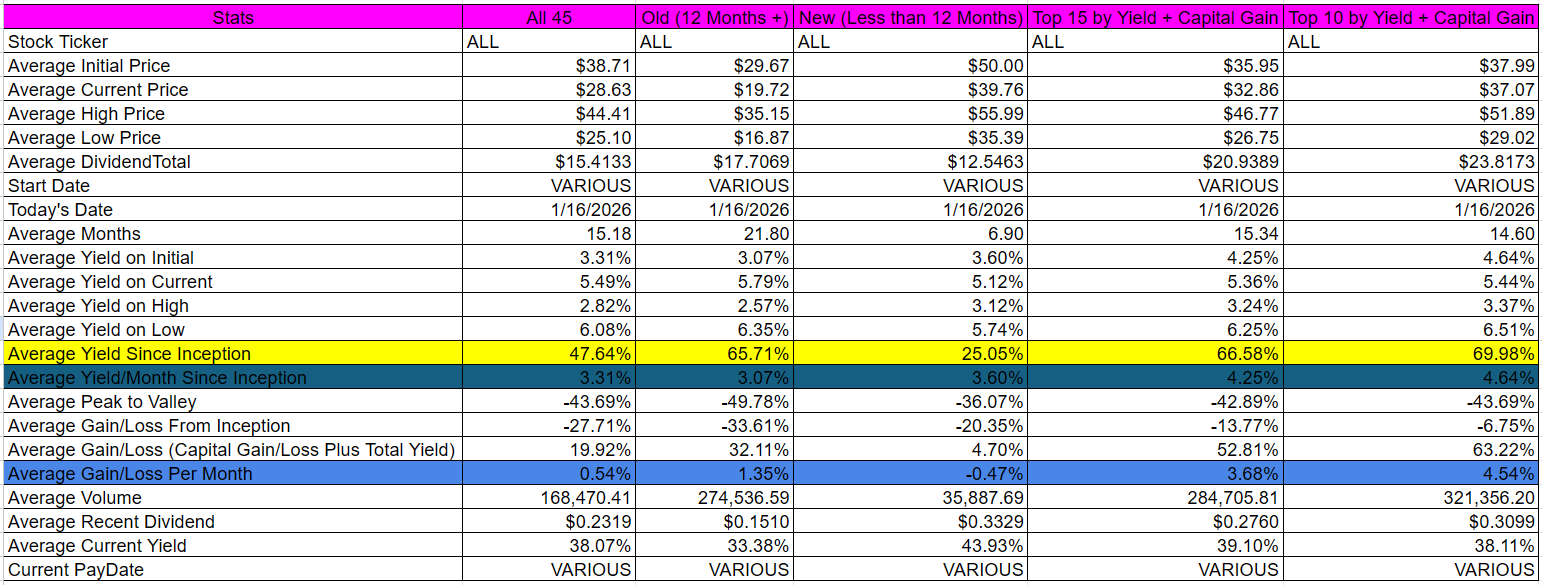
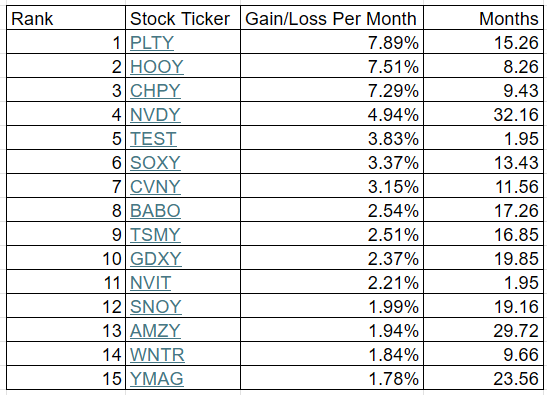
And then here are the top 15 by “yield + capital gain” — but normalized by months in existence…
Please note these performance figures are “yield + capital gain” normalized by month (total yield + total capital gain / months in existence). This is NOT current yield.
Also note that these are “since inception” numbers which reflect the ENTIRE historical record of an ETF — not necessarily current trends.
For all of the entries below, do make sure to look at the full picture (the first paragraph of each entry) before riding the rapids of “The River of Current Yield.”
Current yield is still listed (second paragraph of each entry), but that is out of order.
Here everything is sorted by descending “yield + capital gain” (in bold in each first paragraph of each entry). A far more useful metric.
Occasionally we may hold positions in some of these stocks.
All dividends are calculated based on the “Ex-EFF Date.”
This is a free post! To see what else we’re up to, and to support our work, please consider a paid subscription. Only $5/month or $60/year!
We are currently in the middle of our January run. 26 sectors, 647 dividend paying stocks.

In other words, it’s a great time to sign up for a paid subscription!
Individual Stock Analysis (45 Entries)
[1] YieldMax PLTR Option Income Strategy ETF [PLTY]
PLTY had total dividends of $64.8884 from 10/8/2024 to 1/16/2026. It has been active for 15.26 months. During that time frame it had a starting price of $51.43, a high price of $95.08, a low price of $46.28, and a 1/16/2026 price of $48.46. This means that it had a yield of 126.17%, or an average monthly yield of 8.27%. The peak-to-valley is -51.33%. The capital gains were -5.77%. The overall gain/loss (cap gains + yield) is 120.39%, or a gain/loss per month of 7.89%. The average volume since inception was 321,125.
PLTY received a recent dividend of $0.4130 on 1/16/2026. This means the current yield ($0.4130 / $48.46 * weeks/months per year paid) is 44.32%.
[2] YieldMax HOOD Option Income Strategy ETF [HOOY]
HOOY had total dividends of $40.9809 from 5/8/2025 to 1/16/2026. It has been active for 8.26 months. During that time frame it had a starting price of $52.82, a high price of $80.99, a low price of $44.00, and a 1/16/2026 price of $44.63. This means that it had a yield of 77.59%, or an average monthly yield of 9.39%. The peak-to-valley is -45.67%. The capital gains were -15.51%. The overall gain/loss (cap gains + yield) is 62.08%, or a gain/loss per month of 7.51%. The average volume since inception was 196,682.
HOOY received a recent dividend of $0.5501 on 1/16/2026. This means the current yield ($0.5501 / $44.63 * weeks/months per year paid) is 64.09%.
[3] YieldMax Semiconductor Portfolio Option Income ETF [CHPY]
CHPY had total dividends of $16.7023 from 4/3/2025 to 1/16/2026. It has been active for 9.43 months. During that time frame it had a starting price of $45.65, a high price of $60.85, a low price of $40.40, and a 1/16/2026 price of $60.33. This means that it had a yield of 36.59%, or an average monthly yield of 3.88%. The peak-to-valley is -33.61%. The capital gains were 32.16%. The overall gain/loss (cap gains + yield) is 68.75%, or a gain/loss per month of 7.29%. The average volume since inception was 62,621.
CHPY received a recent dividend of $0.5196 on 1/15/2026. This means the current yield ($0.5196 / $60.33 * weeks/months per year paid) is 44.79%.
[4] YieldMax NVDA Option Income Strategy ETF [NVDY]
NVDY had total dividends of $37.0645 from 5/11/2023 to 1/16/2026. It has been active for 32.16 months. During that time frame it had a starting price of $19.91, a high price of $31.77, a low price of $12.47, and a 1/16/2026 price of $14.46. This means that it had a yield of 186.16%, or an average monthly yield of 5.79%. The peak-to-valley is -60.75%. The capital gains were -27.37%. The overall gain/loss (cap gains + yield) is 158.79%, or a gain/loss per month of 4.94%. The average volume since inception was 2,171,946.
NVDY received a recent dividend of $0.0950 on 1/16/2026. This means the current yield ($0.0950 / $14.46 * weeks/months per year paid) is 34.16%.
[5] YieldMax TSLA Performance Distribution Target 25 ETF [TEST]
TEST had total dividends of $1.8207 from 11/18/2025 to 1/16/2026. It has been active for 1.95 months. During that time frame it had a starting price of $49.66, a high price of $57.74, a low price of $47.99, and a 1/16/2026 price of $51.55. This means that it had a yield of 3.67%, or an average monthly yield of 1.88%. The peak-to-valley is -16.89%. The capital gains were 3.81%. The overall gain/loss (cap gains + yield) is 7.47%, or a gain/loss per month of 3.83%. The average volume since inception was 3,129.
TEST received a recent dividend of $0.2505 on 1/14/2026. This means the current yield ($0.2505 / $51.55 * weeks/months per year paid) is 25.27%.
[6] YieldMax Target 12 Semiconductor Option Inc ETF [SOXY]
SOXY had total dividends of $6.8197 from 12/3/2024 to 1/16/2026. It has been active for 13.43 months. During that time frame it had a starting price of $50.10, a high price of $66.50, a low price of $35.02, and a 1/16/2026 price of $65.94. This means that it had a yield of 13.61%, or an average monthly yield of 1.01%. The peak-to-valley is -47.34%. The capital gains were 31.62%. The overall gain/loss (cap gains + yield) is 45.23%, or a gain/loss per month of 3.37%. The average volume since inception was 4,430.
SOXY received a recent dividend of $0.6045 on 1/2/2026. This means the current yield ($0.6045 / $65.94 * weeks/months per year paid) is 11.00%.
[7] YieldMax CVNA Option Income Strategy ETF [CVNY]
CVNY had total dividends of $30.7701 from 1/30/2025 to 1/16/2026. It has been active for 11.56 months. During that time frame it had a starting price of $50.00, a high price of $58.17, a low price of $24.83, and a 1/16/2026 price of $37.45. This means that it had a yield of 61.54%, or an average monthly yield of 5.32%. The peak-to-valley is -57.31%. The capital gains were -25.10%. The overall gain/loss (cap gains + yield) is 36.44%, or a gain/loss per month of 3.15%. The average volume since inception was 66,195.
CVNY received a recent dividend of $0.3134 on 1/16/2026. This means the current yield ($0.3134 / $37.45 * weeks/months per year paid) is 43.52%.
[8] YieldMax BABA Option Income Strategy ETF [BABO]
BABO had total dividends of $15.1471 from 8/8/2024 to 1/16/2026. It has been active for 17.26 months. During that time frame it had a starting price of $20.42, a high price of $25.53, a low price of $12.97, and a 1/16/2026 price of $14.22. This means that it had a yield of 74.18%, or an average monthly yield of 4.30%. The peak-to-valley is -49.20%. The capital gains were -30.36%. The overall gain/loss (cap gains + yield) is 43.82%, or a gain/loss per month of 2.54%. The average volume since inception was 74,541.
BABO received a recent dividend of $0.0864 on 1/16/2026. This means the current yield ($0.0864 / $14.22 * weeks/months per year paid) is 31.59%.
[9] YieldMax TSM Option Income Strategy ETF [TSMY]
TSMY had total dividends of $11.7660 from 8/21/2024 to 1/16/2026. It has been active for 16.85 months. During that time frame it had a starting price of $20.03, a high price of $22.31, a low price of $12.10, and a 1/16/2026 price of $16.73. This means that it had a yield of 58.74%, or an average monthly yield of 3.49%. The peak-to-valley is -45.76%. The capital gains were -16.48%. The overall gain/loss (cap gains + yield) is 42.27%, or a gain/loss per month of 2.51%. The average volume since inception was 79,394.
TSMY received a recent dividend of $0.1387 on 1/16/2026. This means the current yield ($0.1387 / $16.73 * weeks/months per year paid) is 43.11%.
[10] YieldMax Gold Miners Option Income Strategy ETF [GDXY]
GDXY had total dividends of $12.2128 from 5/21/2024 to 1/16/2026. It has been active for 19.85 months. During that time frame it had a starting price of $19.85, a high price of $19.98, a low price of $14.18, and a 1/16/2026 price of $16.97. This means that it had a yield of 61.53%, or an average monthly yield of 3.10%. The peak-to-valley is -29.03%. The capital gains were -14.51%. The overall gain/loss (cap gains + yield) is 47.02%, or a gain/loss per month of 2.37%. The average volume since inception was 233,497.
GDXY received a recent dividend of $0.1281 on 1/16/2026. This means the current yield ($0.1281 / $16.97 * weeks/months per year paid) is 39.25%.
[11] YieldMax NVDA Performance Distribution Target 25 ETF [NVIT]
NVIT had total dividends of $1.6580 from 11/18/2025 to 1/16/2026. It has been active for 1.95 months. During that time frame it had a starting price of $49.25, a high price of $52.27, a low price of $46.91, and a 1/16/2026 price of $49.72. This means that it had a yield of 3.37%, or an average monthly yield of 1.72%. The peak-to-valley is -10.25%. The capital gains were 0.95%. The overall gain/loss (cap gains + yield) is 4.32%, or a gain/loss per month of 2.21%. The average volume since inception was 3,924.
NVIT received a recent dividend of $0.2378 on 1/14/2026. This means the current yield ($0.2378 / $49.72 * weeks/months per year paid) is 24.87%.
[12] YieldMax SNOW Option Income Strategy ETF [SNOY]
SNOY had total dividends of $16.5711 from 6/11/2024 to 1/16/2026. It has been active for 19.16 months. During that time frame it had a starting price of $20.18, a high price of $23.76, a low price of $11.08, and a 1/16/2026 price of $11.31. This means that it had a yield of 82.12%, or an average monthly yield of 4.28%. The peak-to-valley is -53.37%. The capital gains were -43.95%. The overall gain/loss (cap gains + yield) is 38.16%, or a gain/loss per month of 1.99%. The average volume since inception was 113,534.
SNOY received a recent dividend of $0.0674 on 1/16/2026. This means the current yield ($0.0674 / $11.31 * weeks/months per year paid) is 30.99%.
[13] YieldMax AMZN Option Income Strategy ETF [AMZY]
AMZY had total dividends of $18.3401 from 7/25/2023 to 1/16/2026. It has been active for 29.72 months. During that time frame it had a starting price of $20.05, a high price of $24.10, a low price of $12.90, and a 1/16/2026 price of $13.29. This means that it had a yield of 91.47%, or an average monthly yield of 3.08%. The peak-to-valley is -46.47%. The capital gains were -33.72%. The overall gain/loss (cap gains + yield) is 57.76%, or a gain/loss per month of 1.94%. The average volume since inception was 258,743.
AMZY received a recent dividend of $0.0959 on 1/16/2026. This means the current yield ($0.0959 / $13.29 * weeks/months per year paid) is 37.52%.
[14] YieldMax MSTR Short Option Income Strategy ETF [WNTR]
WNTR had total dividends of $25.0110 from 3/27/2025 to 1/16/2026. It has been active for 9.66 months. During that time frame it had a starting price of $50.06, a high price of $60.64, a low price of $27.24, and a 1/16/2026 price of $33.94. This means that it had a yield of 49.96%, or an average monthly yield of 5.17%. The peak-to-valley is -55.08%. The capital gains were -32.20%. The overall gain/loss (cap gains + yield) is 17.76%, or a gain/loss per month of 1.84%. The average volume since inception was 111,672.
WNTR received a recent dividend of $0.5767 on 1/16/2026. This means the current yield ($0.5767 / $33.94 * weeks/months per year paid) is 88.36%.
[15] YieldMax Magnificent 7 Fund of Option Income ETFs [YMAG]
YMAG had total dividends of $14.3308 from 1/30/2024 to 1/16/2026. It has been active for 23.56 months. During that time frame it had a starting price of $19.89, a high price of $21.91, a low price of $12.85, and a 1/16/2026 price of $13.90. This means that it had a yield of 72.05%, or an average monthly yield of 3.06%. The peak-to-valley is -41.35%. The capital gains were -30.12%. The overall gain/loss (cap gains + yield) is 41.93%, or a gain/loss per month of 1.78%. The average volume since inception was 569,151.
YMAG received a recent dividend of $0.0634 on 1/15/2026. This means the current yield ($0.0634 / $13.90 * weeks/months per year paid) is 23.72%.
[16] YieldMax NFLX Option Income Strategy ETF [NFLY]
NFLY had total dividends of $18.8544 from 8/8/2023 to 1/16/2026. It has been active for 29.26 months. During that time frame it had a starting price of $19.99, a high price of $20.36, a low price of $11.20, and a 1/16/2026 price of $11.24. This means that it had a yield of 94.32%, or an average monthly yield of 3.22%. The peak-to-valley is -44.99%. The capital gains were -43.77%. The overall gain/loss (cap gains + yield) is 50.55%, or a gain/loss per month of 1.73%. The average volume since inception was 122,000.
NFLY received a recent dividend of $0.0645 on 1/16/2026. This means the current yield ($0.0645 / $11.24 * weeks/months per year paid) is 29.84%.
[17] YieldMax META Option Income Strategy ETF [FBY]
FBY had total dividends of $19.2499 from 7/28/2023 to 1/16/2026. It has been active for 29.62 months. During that time frame it had a starting price of $20.63, a high price of $24.49, a low price of $11.68, and a 1/16/2026 price of $11.80. This means that it had a yield of 93.31%, or an average monthly yield of 3.15%. The peak-to-valley is -52.31%. The capital gains were -42.80%. The overall gain/loss (cap gains + yield) is 50.51%, or a gain/loss per month of 1.70%. The average volume since inception was 122,209.
FBY received a recent dividend of $0.0583 on 1/16/2026. This means the current yield ($0.0583 / $11.80 * weeks/months per year paid) is 25.69%.
[18] YieldMax Russell 2000 0DTE Covered Call Strat ETF [RDTY]
RDTY had total dividends of $14.8479 from 3/6/2025 to 1/16/2026. It has been active for 10.33 months. During that time frame it had a starting price of $49.21, a high price of $50.07, a low price of $39.16, and a 1/16/2026 price of $41.06. This means that it had a yield of 30.17%, or an average monthly yield of 2.92%. The peak-to-valley is -21.79%. The capital gains were -16.56%. The overall gain/loss (cap gains + yield) is 13.61%, or a gain/loss per month of 1.32%. The average volume since inception was 7,318.
RDTY received a recent dividend of $0.2741 on 1/15/2026. This means the current yield ($0.2741 / $41.06 * weeks/months per year paid) is 34.71%.
[19] YieldMax MSFT Option Income Strategy ETF [MSFO]
MSFO had total dividends of $13.2422 from 8/25/2023 to 1/16/2026. It has been active for 28.72 months. During that time frame it had a starting price of $20.18, a high price of $23.48, a low price of $14.30, and a 1/16/2026 price of $14.55. This means that it had a yield of 65.62%, or an average monthly yield of 2.28%. The peak-to-valley is -39.10%. The capital gains were -27.90%. The overall gain/loss (cap gains + yield) is 37.72%, or a gain/loss per month of 1.31%. The average volume since inception was 62,545.
MSFO received a recent dividend of $0.0593 on 1/16/2026. This means the current yield ($0.0593 / $14.55 * weeks/months per year paid) is 21.19%.
[20] YieldMax AI & Tech Portfolio Option Income ETF [GPTY]
GPTY had total dividends of $15.1418 from 1/23/2025 to 1/16/2026. It has been active for 11.79 months. During that time frame it had a starting price of $50.09, a high price of $50.43, a low price of $32.92, and a 1/16/2026 price of $42.66. This means that it had a yield of 30.23%, or an average monthly yield of 2.56%. The peak-to-valley is -34.72%. The capital gains were -14.83%. The overall gain/loss (cap gains + yield) is 15.40%, or a gain/loss per month of 1.31%. The average volume since inception was 36,810.
GPTY received a recent dividend of $0.3365 on 1/15/2026. This means the current yield ($0.3365 / $42.66 * weeks/months per year paid) is 41.02%.
[21] YieldMax GOOGL Option Income Strategy ETF [GOOY]
GOOY had total dividends of $13.2130 from 7/28/2023 to 1/16/2026. It has been active for 29.62 months. During that time frame it had a starting price of $20.50, a high price of $20.83, a low price of $10.89, and a 1/16/2026 price of $14.98. This means that it had a yield of 64.45%, or an average monthly yield of 2.18%. The peak-to-valley is -47.72%. The capital gains were -26.93%. The overall gain/loss (cap gains + yield) is 37.53%, or a gain/loss per month of 1.27%. The average volume since inception was 144,477.
GOOY received a recent dividend of $0.0981 on 1/16/2026. This means the current yield ($0.0981 / $14.98 * weeks/months per year paid) is 34.05%.
[22] YieldMax Target 12 Big 50 Option Income ETF [BIGY]
BIGY had total dividends of $6.5604 from 11/21/2024 to 1/16/2026. It has been active for 13.85 months. During that time frame it had a starting price of $50.15, a high price of $54.64, a low price of $40.00, and a 1/16/2026 price of $52.13. This means that it had a yield of 13.08%, or an average monthly yield of 0.94%. The peak-to-valley is -26.79%. The capital gains were 3.95%. The overall gain/loss (cap gains + yield) is 17.03%, or a gain/loss per month of 1.23%. The average volume since inception was 6,080.
BIGY received a recent dividend of $0.5325 on 1/2/2026. This means the current yield ($0.5325 / $52.13 * weeks/months per year paid) is 12.26%.
[23] YieldMax Universe Fund of Option Income ETFs [YMAX]
YMAX had total dividends of $15.5153 from 1/17/2024 to 1/16/2026. It has been active for 23.99 months. During that time frame it had a starting price of $19.90, a high price of $21.94, a low price of $9.98, and a 1/16/2026 price of $10.06. This means that it had a yield of 77.97%, or an average monthly yield of 3.25%. The peak-to-valley is -54.51%. The capital gains were -49.45%. The overall gain/loss (cap gains + yield) is 28.52%, or a gain/loss per month of 1.19%. The average volume since inception was 1,370,223.
YMAX received a recent dividend of $0.0816 on 1/15/2026. This means the current yield ($0.0816 / $10.06 * weeks/months per year paid) is 42.18%.
[24] YieldMax JPM Option Income Strategy ETF [JPMO]
JPMO had total dividends of $11.1986 from 9/12/2023 to 1/16/2026. It has been active for 28.13 months. During that time frame it had a starting price of $20.06, a high price of $22.30, a low price of $13.64, and a 1/16/2026 price of $15.31. This means that it had a yield of 55.83%, or an average monthly yield of 1.98%. The peak-to-valley is -38.83%. The capital gains were -23.68%. The overall gain/loss (cap gains + yield) is 32.15%, or a gain/loss per month of 1.14%. The average volume since inception was 28,783.
JPMO received a recent dividend of $0.0768 on 1/16/2026. This means the current yield ($0.0768 / $15.31 * weeks/months per year paid) is 26.08%.
[25] YieldMax Nasdaq 100 0DTE Covered Call Strategy ETF [QDTY]
QDTY had total dividends of $12.0169 from 2/13/2025 to 1/16/2026. It has been active for 11.1 months. During that time frame it had a starting price of $50.61, a high price of $52.55, a low price of $36.76, and a 1/16/2026 price of $43.46. This means that it had a yield of 23.74%, or an average monthly yield of 2.14%. The peak-to-valley is -30.05%. The capital gains were -14.13%. The overall gain/loss (cap gains + yield) is 9.62%, or a gain/loss per month of 0.87%. The average volume since inception was 10,877.
QDTY received a recent dividend of $0.2416 on 1/15/2026. This means the current yield ($0.2416 / $43.46 * weeks/months per year paid) is 28.91%.
[26] YieldMax S&P 500 0DTE Covered Call Strategy ETF [SDTY]
SDTY had total dividends of $10.0806 from 2/6/2025 to 1/16/2026. It has been active for 11.33 months. During that time frame it had a starting price of $50.29, a high price of $51.29, a low price of $38.59, and a 1/16/2026 price of $44.75. This means that it had a yield of 20.04%, or an average monthly yield of 1.77%. The peak-to-valley is -24.76%. The capital gains were -11.02%. The overall gain/loss (cap gains + yield) is 9.03%, or a gain/loss per month of 0.80%. The average volume since inception was 10,642.
SDTY received a recent dividend of $0.1805 on 1/15/2026. This means the current yield ($0.1805 / $44.75 * weeks/months per year paid) is 20.97%.
[27] YieldMax Target 12 Real Estate Option Income ETF [RNTY]
RNTY had total dividends of $4.0443 from 4/17/2025 to 1/16/2026. It has been active for 8.99 months. During that time frame it had a starting price of $50.86, a high price of $53.02, a low price of $48.47, and a 1/16/2026 price of $50.45. This means that it had a yield of 7.95%, or an average monthly yield of 0.88%. The peak-to-valley is -8.58%. The capital gains were -0.81%. The overall gain/loss (cap gains + yield) is 7.15%, or a gain/loss per month of 0.80%. The average volume since inception was 1,611.
RNTY received a recent dividend of $0.4937 on 1/2/2026. This means the current yield ($0.4937 / $50.45 * weeks/months per year paid) is 11.74%.
[28] YieldMax DIS Option Income Strategy ETF [DISO]
DISO had total dividends of $12.5855 from 8/25/2023 to 1/16/2026. It has been active for 28.72 months. During that time frame it had a starting price of $20.16, a high price of $22.69, a low price of $11.45, and a 1/16/2026 price of $11.78. This means that it had a yield of 62.43%, or an average monthly yield of 2.17%. The peak-to-valley is -49.54%. The capital gains were -41.57%. The overall gain/loss (cap gains + yield) is 20.86%, or a gain/loss per month of 0.73%. The average volume since inception was 14,734.
DISO received a recent dividend of $0.0521 on 1/16/2026. This means the current yield ($0.0521 / $11.78 * weeks/months per year paid) is 23.00%.
[29] YieldMax AAPL Option Income Strategy ETF [APLY]
APLY had total dividends of $12.1450 from 4/18/2023 to 1/16/2026. It has been active for 32.95 months. During that time frame it had a starting price of $20.20, a high price of $23.02, a low price of $11.72, and a 1/16/2026 price of $12.49. This means that it had a yield of 60.12%, or an average monthly yield of 1.82%. The peak-to-valley is -49.09%. The capital gains were -38.17%. The overall gain/loss (cap gains + yield) is 21.96%, or a gain/loss per month of 0.67%. The average volume since inception was 90,724.
APLY received a recent dividend of $0.0415 on 1/16/2026. This means the current yield ($0.0415 / $12.49 * weeks/months per year paid) is 17.28%.
[30] YieldMax XOM Option Income Strategy ETF [XOMO]
XOMO had total dividends of $8.7032 from 8/31/2023 to 1/16/2026. It has been active for 28.53 months. During that time frame it had a starting price of $20.01, a high price of $23.38, a low price of $11.32, and a 1/16/2026 price of $12.26. This means that it had a yield of 43.49%, or an average monthly yield of 1.52%. The peak-to-valley is -51.58%. The capital gains were -38.73%. The overall gain/loss (cap gains + yield) is 4.76%, or a gain/loss per month of 0.17%. The average volume since inception was 40,815.
XOMO received a recent dividend of $0.0669 on 1/16/2026. This means the current yield ($0.0669 / $12.26 * weeks/months per year paid) is 28.38%.
[31] YieldMax Crypto Industry & Tech Port Opt Inc ETF [LFGY]
LFGY had total dividends of $24.2486 from 1/14/2025 to 1/16/2026. It has been active for 12.07 months. During that time frame it had a starting price of $51.25, a high price of $55.11, a low price of $24.89, and a 1/16/2026 price of $27.10. This means that it had a yield of 47.31%, or an average monthly yield of 3.92%. The peak-to-valley is -54.84%. The capital gains were -47.12%. The overall gain/loss (cap gains + yield) is 0.19%, or a gain/loss per month of 0.02%. The average volume since inception was 143,675.
LFGY received a recent dividend of $0.2835 on 1/15/2026. This means the current yield ($0.2835 / $27.10 * weeks/months per year paid) is 54.40%.
[32] YieldMax BRK B Option Income Strategy ETF [BRKC]
BRKC had total dividends of $5.2512 from 6/5/2025 to 1/16/2026. It has been active for 7.36 months. During that time frame it had a starting price of $49.68, a high price of $50.66, a low price of $43.85, and a 1/16/2026 price of $44.13. This means that it had a yield of 10.57%, or an average monthly yield of 1.44%. The peak-to-valley is -13.44%. The capital gains were -11.17%. The overall gain/loss (cap gains + yield) is -0.60%, or a gain/loss per month of -0.08%. The average volume since inception was 11,853.
BRKC received a recent dividend of $0.1260 on 1/16/2026. This means the current yield ($0.1260 / $44.13 * weeks/months per year paid) is 14.85%.
[33] YieldMax Short N100 Option Income Strategy ETF [YQQQ]
YQQQ had total dividends of $5.3645 from 8/15/2024 to 1/16/2026. It has been active for 17.03 months. During that time frame it had a starting price of $19.64, a high price of $20.55, a low price of $11.89, and a 1/16/2026 price of $12.04. This means that it had a yield of 27.31%, or an average monthly yield of 1.60%. The peak-to-valley is -42.14%. The capital gains were -38.70%. The overall gain/loss (cap gains + yield) is -11.38%, or a gain/loss per month of -0.67%. The average volume since inception was 35,473.
YQQQ received a recent dividend of $0.0373 on 1/16/2026. This means the current yield ($0.0373 / $12.04 * weeks/months per year paid) is 16.11%.
[34] YieldMax Dorsey Wright Hybrid 5 Income ETF [FIVY]
FIVY had total dividends of $14.6067 from 12/17/2024 to 1/16/2026. It has been active for 12.99 months. During that time frame it had a starting price of $49.78, a high price of $52.51, a low price of $29.34, and a 1/16/2026 price of $30.46. This means that it had a yield of 29.34%, or an average monthly yield of 2.26%. The peak-to-valley is -44.12%. The capital gains were -38.81%. The overall gain/loss (cap gains + yield) is -9.47%, or a gain/loss per month of -0.73%. The average volume since inception was 10,387.
FIVY received a recent dividend of $0.1765 on 1/15/2026. This means the current yield ($0.1765 / $30.46 * weeks/months per year paid) is 30.13%.
[35] YieldMax Dorsey Wright Featured 5 Income ETF [FEAT]
FEAT had total dividends of $19.6217 from 12/17/2024 to 1/16/2026. It has been active for 12.99 months. During that time frame it had a starting price of $49.71, a high price of $50.21, a low price of $24.39, and a 1/16/2026 price of $24.53. This means that it had a yield of 39.47%, or an average monthly yield of 3.04%. The peak-to-valley is -51.42%. The capital gains were -50.65%. The overall gain/loss (cap gains + yield) is -11.18%, or a gain/loss per month of -0.86%. The average volume since inception was 26,033.
FEAT received a recent dividend of $0.2494 on 1/15/2026. This means the current yield ($0.2494 / $24.53 * weeks/months per year paid) is 52.87%.
[36] YieldMax SMCI Option Income Strategy ETF [SMCY]
SMCY had total dividends of $28.9109 from 9/12/2024 to 1/16/2026. It has been active for 16.13 months. During that time frame it had a starting price of $50.62, a high price of $59.20, a low price of $7.67, and a 1/16/2026 price of $8.56. This means that it had a yield of 57.11%, or an average monthly yield of 3.54%. The peak-to-valley is -87.04%. The capital gains were -83.09%. The overall gain/loss (cap gains + yield) is -25.98%, or a gain/loss per month of -1.61%. The average volume since inception was 642,931.
SMCY received a recent dividend of $0.0860 on 1/16/2026. This means the current yield ($0.0860 / $8.56 * weeks/months per year paid) is 52.24%.
[37] YieldMax RDDT Option Income Strategy ETF [RDYY]
RDYY had total dividends of $11.1319 from 9/9/2025 to 1/16/2026. It has been active for 4.23 months. During that time frame it had a starting price of $51.29, a high price of $56.57, a low price of $34.17, and a 1/16/2026 price of $36.03. This means that it had a yield of 21.70%, or an average monthly yield of 5.13%. The peak-to-valley is -39.60%. The capital gains were -29.75%. The overall gain/loss (cap gains + yield) is -8.05%, or a gain/loss per month of -1.90%. The average volume since inception was 34,015.
RDYY received a recent dividend of $0.6558 on 1/16/2026. This means the current yield ($0.6558 / $36.03 * weeks/months per year paid) is 94.65%.
[38] YieldMax MARA Option Income Strategy ETF [MARO]
MARO had total dividends of $21.5109 from 12/10/2024 to 1/16/2026. It has been active for 13.2 months. During that time frame it had a starting price of $47.14, a high price of $53.06, a low price of $7.48, and a 1/16/2026 price of $8.45. This means that it had a yield of 45.63%, or an average monthly yield of 3.46%. The peak-to-valley is -85.90%. The capital gains were -82.07%. The overall gain/loss (cap gains + yield) is -36.44%, or a gain/loss per month of -2.76%. The average volume since inception was 175,964.
MARO received a recent dividend of $0.1188 on 1/16/2026. This means the current yield ($0.1188 / $8.45 * weeks/months per year paid) is 73.11%.
[39] YieldMax GME Option Income Strategy ETF [GMEY]
GMEY had total dividends of $8.7653 from 9/9/2025 to 1/16/2026. It has been active for 4.23 months. During that time frame it had a starting price of $50.43, a high price of $56.15, a low price of $35.07, and a 1/16/2026 price of $35.45. This means that it had a yield of 17.38%, or an average monthly yield of 4.11%. The peak-to-valley is -37.54%. The capital gains were -29.70%. The overall gain/loss (cap gains + yield) is -12.32%, or a gain/loss per month of -2.91%. The average volume since inception was 13,267.
GMEY received a recent dividend of $0.3306 on 1/16/2026. This means the current yield ($0.3306 / $35.45 * weeks/months per year paid) is 48.49%.
[40] YieldMax RBLX Option Income Strategy ETF [RBLY]
RBLY had total dividends of $11.5107 from 7/29/2025 to 1/16/2026. It has been active for 5.59 months. During that time frame it had a starting price of $49.34, a high price of $58.42, a low price of $25.64, and a 1/16/2026 price of $29.67. This means that it had a yield of 23.33%, or an average monthly yield of 4.17%. The peak-to-valley is -56.11%. The capital gains were -39.87%. The overall gain/loss (cap gains + yield) is -16.54%, or a gain/loss per month of -2.96%. The average volume since inception was 13,665.
RBLY received a recent dividend of $0.2547 on 1/16/2026. This means the current yield ($0.2547 / $29.67 * weeks/months per year paid) is 44.64%.
[41] YieldMax DKNG Option Income Strategy ETF [DRAY]
DRAY had total dividends of $10.8541 from 7/15/2025 to 1/16/2026. It has been active for 6.03 months. During that time frame it had a starting price of $50.09, a high price of $53.95, a low price of $27.56, and a 1/16/2026 price of $28.62. This means that it had a yield of 21.67%, or an average monthly yield of 3.59%. The peak-to-valley is -48.92%. The capital gains were -42.86%. The overall gain/loss (cap gains + yield) is -21.19%, or a gain/loss per month of -3.51%. The average volume since inception was 14,309.
DRAY received a recent dividend of $0.1772 on 1/16/2026. This means the current yield ($0.1772 / $28.62 * weeks/months per year paid) is 32.20%.
[42] YieldMax Ultra Short Option Income Strategy ETF [SLTY]
SLTY had total dividends of $10.8432 from 8/21/2025 to 1/16/2026. It has been active for 4.85 months. During that time frame it had a starting price of $49.96, a high price of $50.47, a low price of $29.99, and a 1/16/2026 price of $30.13. This means that it had a yield of 21.70%, or an average monthly yield of 4.47%. The peak-to-valley is -40.58%. The capital gains were -39.69%. The overall gain/loss (cap gains + yield) is -17.99%, or a gain/loss per month of -3.71%. The average volume since inception was 52,634.
SLTY received a recent dividend of $0.3580 on 1/15/2026. This means the current yield ($0.3580 / $30.13 * weeks/months per year paid) is 61.79%.
[43] YieldMax MSTR Performance & Distribution Tg 25 ETF [MSST]
MSST had total dividends of $1.4788 from 11/18/2025 to 1/16/2026. It has been active for 1.95 months. During that time frame it had a starting price of $53.14, a high price of $54.29, a low price of $39.91, and a 1/16/2026 price of $44.69. This means that it had a yield of 2.78%, or an average monthly yield of 1.42%. The peak-to-valley is -26.49%. The capital gains were -15.90%. The overall gain/loss (cap gains + yield) is -13.12%, or a gain/loss per month of -6.72%. The average volume since inception was 1,914.
MSST received a recent dividend of $0.1987 on 1/14/2026. This means the current yield ($0.1987 / $44.69 * weeks/months per year paid) is 23.12%.
[44] YieldMax CRCL Option Income Strategy ETF [CRCO]
CRCO had total dividends of $9.7839 from 9/30/2025 to 1/16/2026. It has been active for 3.56 months. During that time frame it had a starting price of $49.21, a high price of $57.31, a low price of $21.84, and a 1/16/2026 price of $23.25. This means that it had a yield of 19.88%, or an average monthly yield of 5.59%. The peak-to-valley is -61.89%. The capital gains were -52.75%. The overall gain/loss (cap gains + yield) is -32.87%, or a gain/loss per month of -9.24%. The average volume since inception was 44,969.
CRCO received a recent dividend of $0.3418 on 1/16/2026. This means the current yield ($0.3418 / $23.25 * weeks/months per year paid) is 76.45%.
[45] YieldMax HIMS Option Income Strategy ETF [HIYY]
HIYY had total dividends of $8.2332 from 9/23/2025 to 1/16/2026. It has been active for 3.79 months. During that time frame it had a starting price of $48.32, a high price of $53.97, a low price of $22.56, and a 1/16/2026 price of $23.17. This means that it had a yield of 17.04%, or an average monthly yield of 4.50%. The peak-to-valley is -58.20%. The capital gains were -52.05%. The overall gain/loss (cap gains + yield) is -35.01%, or a gain/loss per month of -9.24%. The average volume since inception was 19,646.
HIYY received a recent dividend of $0.2416 on 1/16/2026. This means the current yield ($0.2416 / $23.17 * weeks/months per year paid) is 54.22%.