
YIELDMAX -- Yield + Capital Gain Analysis 2/13/2026
A more realistic view of current yield trends

As always, please read our disclaimer. Important!
YieldMax’s Reverse Splits
YieldMax did a massive reverse split across 15 of its products last year.
It’s not worth repeating all of that as a more in-depth discussion can be found here:

YieldMax has yet to properly reverse-adjust their dividend reporting (something which most companies do as a matter of course) which means that unfortunately again this week we are going to skip all 15 of those affected products. They will not appear in the analysis below.
The tickers we are skipping are:
ABNY, AIYY, AMDY, CONY, CRSH, DIPS, FIAT, MRNY, MSTY, OARK, PYPY, TSLY, ULTY, XYZY, YBIT.
The Current Yield Conundrum
We did a post recently on NAV erosion which speaks directly to reverse-split issues in the “covered call ETF” space…

…and it’s not really worth repeating all of that here either.
But that article is worth taking the time to read because it makes a simple core point: if an ETF pays massive distributions, that money has to come from somewhere.
Covered‑call ETFs are marketed as generating payouts from option premiums.
But in practice, many funds also rely heavily on Return of Capital (ROC) — meaning part of the “distribution” is just your own money being handed back to you to make the yield look bigger.
Return of Capital in practice works a lot like a reverse mortgage: you receive steady payments, but the underlying asset slowly deteriorates.
With a reverse mortgage, it is generally understood that the bank will eventually own the house.
But for covered‑call ETFs in combination with ROC, many investors don’t realize the same dynamic applies — their principal can erode underneath them while the fund is sending out big checks.
Investors see huge yields and assume at the end of the year they will have not only their original investment but all of that income as well. But if much of the payout is ROC, the fund’s NAV may fall as fast as (or faster than) distributions. The result of which is that you can get paid eye‑popping distributions… and still lose money overall.
Again, that’s all covered in this post…
…so we don’t really need to belabor the point any further other than to say — “current yield isn’t exactly what you think it would be.”
YieldMax General Info
Given the popularity of YieldMax we thought we would continue our analysis of all of their products from the standpoint of “yield + capital gain.”
As mentioned last week, YieldMax has transitioned almost all of their products to a weekly-pay model — meaning you get paid a distribution once a week for all YieldMax products except BIGY, RNTY, and SOXY (those are still monthly-payers for the moment).
We will be keeping YieldMax separate from the other weekly payers, because 100+ stocks is just way too many to cover in one post.
If you’d like to see the weekly payers, check out the most recent post here:

Analysis Tables
Here is a summary of all YieldMax products which you might find useful, including Top 10 and Top 15 by “yield + capital gain” sections (the right two columns).
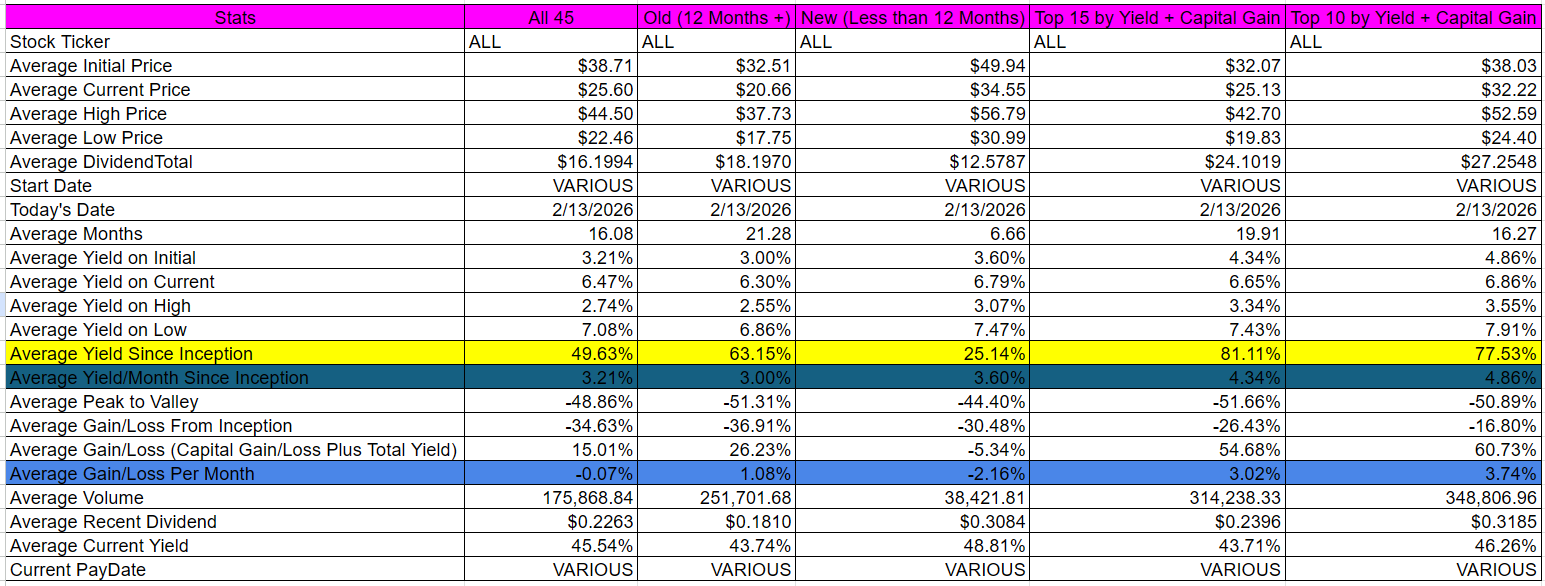
And then here are the top 15 by “yield + capital gain” — but normalized by months in existence…
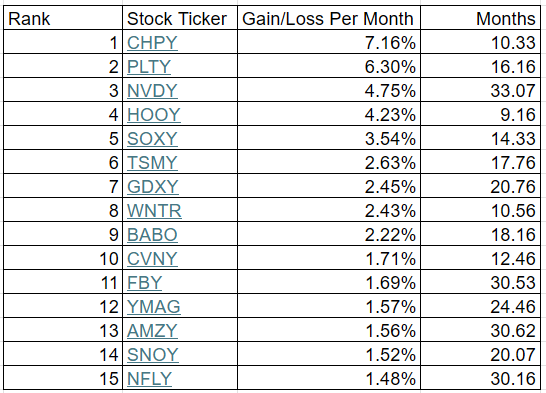
Please note these performance figures are “yield + capital gain” normalized by month (total yield + total capital gain / months in existence). This is NOT current yield.
Also note that these are “since inception” numbers which reflect the ENTIRE historical record of an ETF — not necessarily current trends.
For all of the entries below, do make sure to look at the full picture (the first paragraph of each entry) before riding the rapids of “The River of Current Yield.”
Current yield is still listed (second paragraph of each entry), but that is out of order.
Here everything is sorted by descending “yield + capital gain” (in bold in each first paragraph of each entry). A far more useful metric.
Occasionally we may hold positions in some of these stocks.
All dividends are calculated based on the “Ex-EFF Date.”
This is a free post! To see what else we’re up to, and to support our work, please consider a paid subscription. Only $5/month or $60/year!
We just completed our January run. 26 sectors, 647 dividend paying stocks.

In other words, it’s a great time to sign up for a paid subscription!
Individual Stock Analysis (45 Entries)
[1] YieldMax Semiconductor Portfolio Option Income ETF [CHPY]
CHPY had total dividends of $18.7662 from 4/3/2025 to 2/13/2026. It has been active for 10.33 months. During that time frame it had a starting price of $45.65, a high price of $62.04, a low price of $40.40, and a 2/13/2026 price of $60.65. This means that it had a yield of 41.11%, or an average monthly yield of 3.98%. The peak-to-valley is -34.88%. The capital gains were 32.86%. The overall gain/loss (cap gains + yield) is 73.97%, or a gain/loss per month of 7.16%. The average volume since inception was 85,334.
CHPY received a recent dividend of $0.5293 on 2/12/2026. This means the current yield ($0.5293 / $60.65 * weeks/months per year paid) is 45.38%.
[2] YieldMax PLTR Option Income Strategy ETF [PLTY]
PLTY had total dividends of $66.3799 from 10/8/2024 to 2/13/2026. It has been active for 16.16 months. During that time frame it had a starting price of $51.43, a high price of $95.08, a low price of $36.08, and a 2/13/2026 price of $37.40. This means that it had a yield of 129.07%, or an average monthly yield of 7.98%. The peak-to-valley is -62.05%. The capital gains were -27.28%. The overall gain/loss (cap gains + yield) is 101.79%, or a gain/loss per month of 6.30%. The average volume since inception was 322,772.
PLTY received a recent dividend of $0.3845 on 2/13/2026. This means the current yield ($0.3845 / $37.40 * weeks/months per year paid) is 53.46%.
[3] YieldMax NVDA Option Income Strategy ETF [NVDY]
NVDY had total dividends of $37.4565 from 5/11/2023 to 2/13/2026. It has been active for 33.07 months. During that time frame it had a starting price of $19.91, a high price of $31.77, a low price of $12.47, and a 2/13/2026 price of $13.72. This means that it had a yield of 188.13%, or an average monthly yield of 5.69%. The peak-to-valley is -60.75%. The capital gains were -31.09%. The overall gain/loss (cap gains + yield) is 157.04%, or a gain/loss per month of 4.75%. The average volume since inception was 2,267,079.
NVDY received a recent dividend of $0.1057 on 2/13/2026. This means the current yield ($0.1057 / $13.72 * weeks/months per year paid) is 40.06%.
[4] YieldMax HOOD Option Income Strategy ETF [HOOY]
HOOY had total dividends of $42.5964 from 5/8/2025 to 2/13/2026. It has been active for 9.16 months. During that time frame it had a starting price of $52.82, a high price of $80.99, a low price of $29.00, and a 2/13/2026 price of $30.71. This means that it had a yield of 80.64%, or an average monthly yield of 8.80%. The peak-to-valley is -64.19%. The capital gains were -41.86%. The overall gain/loss (cap gains + yield) is 38.79%, or a gain/loss per month of 4.23%. The average volume since inception was 194,539.
HOOY received a recent dividend of $0.3423 on 2/13/2026. This means the current yield ($0.3423 / $30.71 * weeks/months per year paid) is 57.96%.
[5] YieldMax Target 12 Semiconductor Option Inc ETF [SOXY]
SOXY had total dividends of $7.4910 from 12/3/2024 to 2/13/2026. It has been active for 14.33 months. During that time frame it had a starting price of $50.10, a high price of $69.38, a low price of $35.02, and a 2/13/2026 price of $68.04. This means that it had a yield of 14.95%, or an average monthly yield of 1.04%. The peak-to-valley is -49.52%. The capital gains were 35.81%. The overall gain/loss (cap gains + yield) is 50.76%, or a gain/loss per month of 3.54%. The average volume since inception was 4,915.
SOXY received a recent dividend of $0.6713 on 2/5/2026. This means the current yield ($0.6713 / $68.04 * weeks/months per year paid) is 11.84%.
[6] YieldMax TSM Option Income Strategy ETF [TSMY]
TSMY had total dividends of $12.3207 from 8/21/2024 to 2/13/2026. It has been active for 17.76 months. During that time frame it had a starting price of $20.03, a high price of $22.31, a low price of $12.10, and a 2/13/2026 price of $17.06. This means that it had a yield of 61.51%, or an average monthly yield of 3.46%. The peak-to-valley is -45.76%. The capital gains were -14.83%. The overall gain/loss (cap gains + yield) is 46.68%, or a gain/loss per month of 2.63%. The average volume since inception was 82,805.
TSMY received a recent dividend of $0.1342 on 2/13/2026. This means the current yield ($0.1342 / $17.06 * weeks/months per year paid) is 40.91%.
[7] YieldMax Gold Miners Option Income Strategy ETF [GDXY]
GDXY had total dividends of $12.9796 from 5/21/2024 to 2/13/2026. It has been active for 20.76 months. During that time frame it had a starting price of $19.85, a high price of $19.98, a low price of $14.18, and a 2/13/2026 price of $16.98. This means that it had a yield of 65.39%, or an average monthly yield of 3.15%. The peak-to-valley is -29.03%. The capital gains were -14.46%. The overall gain/loss (cap gains + yield) is 50.93%, or a gain/loss per month of 2.45%. The average volume since inception was 265,461.
GDXY received a recent dividend of $0.1629 on 2/13/2026. This means the current yield ($0.1629 / $16.98 * weeks/months per year paid) is 49.89%.
[8] YieldMax MSTR Short Option Income Strategy ETF [WNTR]
WNTR had total dividends of $26.8418 from 3/27/2025 to 2/13/2026. It has been active for 10.56 months. During that time frame it had a starting price of $50.06, a high price of $60.64, a low price of $27.24, and a 2/13/2026 price of $36.06. This means that it had a yield of 53.62%, or an average monthly yield of 5.08%. The peak-to-valley is -55.08%. The capital gains were -27.97%. The overall gain/loss (cap gains + yield) is 25.65%, or a gain/loss per month of 2.43%. The average volume since inception was 125,601.
WNTR received a recent dividend of $0.4544 on 2/13/2026. This means the current yield ($0.4544 / $36.06 * weeks/months per year paid) is 65.53%.
[9] YieldMax BABA Option Income Strategy ETF [BABO]
BABO had total dividends of $15.6771 from 8/8/2024 to 2/13/2026. It has been active for 18.16 months. During that time frame it had a starting price of $20.42, a high price of $25.53, a low price of $12.68, and a 2/13/2026 price of $12.98. This means that it had a yield of 76.77%, or an average monthly yield of 4.23%. The peak-to-valley is -50.33%. The capital gains were -36.43%. The overall gain/loss (cap gains + yield) is 40.34%, or a gain/loss per month of 2.22%. The average volume since inception was 74,209.
BABO received a recent dividend of $0.1138 on 2/13/2026. This means the current yield ($0.1138 / $12.98 * weeks/months per year paid) is 45.59%.
[10] YieldMax CVNA Option Income Strategy ETF [CVNY]
CVNY had total dividends of $32.0389 from 1/30/2025 to 2/13/2026. It has been active for 12.46 months. During that time frame it had a starting price of $50.00, a high price of $58.17, a low price of $24.83, and a 2/13/2026 price of $28.62. This means that it had a yield of 64.08%, or an average monthly yield of 5.14%. The peak-to-valley is -57.31%. The capital gains were -42.76%. The overall gain/loss (cap gains + yield) is 21.32%, or a gain/loss per month of 1.71%. The average volume since inception was 65,356.
CVNY received a recent dividend of $0.2861 on 2/13/2026. This means the current yield ($0.2861 / $28.62 * weeks/months per year paid) is 51.98%.
[11] YieldMax META Option Income Strategy ETF [FBY]
FBY had total dividends of $19.6842 from 7/28/2023 to 2/13/2026. It has been active for 30.53 months. During that time frame it had a starting price of $20.63, a high price of $24.49, a low price of $11.46, and a 2/13/2026 price of $11.58. This means that it had a yield of 95.42%, or an average monthly yield of 3.13%. The peak-to-valley is -53.21%. The capital gains were -43.87%. The overall gain/loss (cap gains + yield) is 51.55%, or a gain/loss per month of 1.69%. The average volume since inception was 123,763.
FBY received a recent dividend of $0.0776 on 2/13/2026. This means the current yield ($0.0776 / $11.58 * weeks/months per year paid) is 34.85%.
[12] YieldMax Magnificent 7 Fund of Option Income ETFs [YMAG]
YMAG had total dividends of $14.6897 from 1/30/2024 to 2/13/2026. It has been active for 24.46 months. During that time frame it had a starting price of $19.89, a high price of $21.91, a low price of $12.83, and a 2/13/2026 price of $12.86. This means that it had a yield of 73.85%, or an average monthly yield of 3.02%. The peak-to-valley is -41.44%. The capital gains were -35.34%. The overall gain/loss (cap gains + yield) is 38.51%, or a gain/loss per month of 1.57%. The average volume since inception was 602,657.
YMAG received a recent dividend of $0.1149 on 2/12/2026. This means the current yield ($0.1149 / $12.86 * weeks/months per year paid) is 46.46%.
[13] YieldMax AMZN Option Income Strategy ETF [AMZY]
AMZY had total dividends of $18.6192 from 7/25/2023 to 2/13/2026. It has been active for 30.62 months. During that time frame it had a starting price of $20.05, a high price of $24.10, a low price of $10.95, and a 2/13/2026 price of $11.01. This means that it had a yield of 92.86%, or an average monthly yield of 3.03%. The peak-to-valley is -54.56%. The capital gains were -45.09%. The overall gain/loss (cap gains + yield) is 47.78%, or a gain/loss per month of 1.56%. The average volume since inception was 265,400.
AMZY received a recent dividend of $0.0783 on 2/13/2026. This means the current yield ($0.0783 / $11.01 * weeks/months per year paid) is 36.98%.
[14] YieldMax SNOW Option Income Strategy ETF [SNOY]
SNOY had total dividends of $16.8668 from 6/11/2024 to 2/13/2026. It has been active for 20.07 months. During that time frame it had a starting price of $20.18, a high price of $23.76, a low price of $8.50, and a 2/13/2026 price of $9.48. This means that it had a yield of 83.58%, or an average monthly yield of 4.17%. The peak-to-valley is -64.23%. The capital gains were -53.02%. The overall gain/loss (cap gains + yield) is 30.56%, or a gain/loss per month of 1.52%. The average volume since inception was 111,536.
SNOY received a recent dividend of $0.0770 on 2/13/2026. This means the current yield ($0.0770 / $9.48 * weeks/months per year paid) is 42.24%.
[15] YieldMax NFLX Option Income Strategy ETF [NFLY]
NFLY had total dividends of $19.1199 from 8/8/2023 to 2/13/2026. It has been active for 30.16 months. During that time frame it had a starting price of $19.99, a high price of $20.36, a low price of $9.66, and a 2/13/2026 price of $9.78. This means that it had a yield of 95.65%, or an average monthly yield of 3.17%. The peak-to-valley is -52.55%. The capital gains were -51.08%. The overall gain/loss (cap gains + yield) is 44.57%, or a gain/loss per month of 1.48%. The average volume since inception was 122,151.
NFLY received a recent dividend of $0.0611 on 2/13/2026. This means the current yield ($0.0611 / $9.78 * weeks/months per year paid) is 32.49%.
[16] YieldMax TSLA Performance Distribution Target 25 ETF [TEST]
TEST had total dividends of $2.7952 from 11/18/2025 to 2/13/2026. It has been active for 2.85 months. During that time frame it had a starting price of $49.66, a high price of $57.74, a low price of $46.10, and a 2/13/2026 price of $48.61. This means that it had a yield of 5.63%, or an average monthly yield of 1.97%. The peak-to-valley is -20.16%. The capital gains were -2.11%. The overall gain/loss (cap gains + yield) is 3.51%, or a gain/loss per month of 1.23%. The average volume since inception was 3,090.
TEST received a recent dividend of $0.2319 on 2/11/2026. This means the current yield ($0.2319 / $48.61 * weeks/months per year paid) is 24.81%.
[17] YieldMax Russell 2000 0DTE Covered Call Strat ETF [RDTY]
RDTY had total dividends of $15.9790 from 3/6/2025 to 2/13/2026. It has been active for 11.23 months. During that time frame it had a starting price of $49.21, a high price of $50.07, a low price of $39.16, and a 2/13/2026 price of $39.99. This means that it had a yield of 32.47%, or an average monthly yield of 2.89%. The peak-to-valley is -21.79%. The capital gains were -18.74%. The overall gain/loss (cap gains + yield) is 13.74%, or a gain/loss per month of 1.22%. The average volume since inception was 7,439.
RDTY received a recent dividend of $0.3464 on 2/12/2026. This means the current yield ($0.3464 / $39.99 * weeks/months per year paid) is 45.04%.
[18] YieldMax NVDA Performance Distribution Target 25 ETF [NVIT]
NVIT had total dividends of $2.6088 from 11/18/2025 to 2/13/2026. It has been active for 2.85 months. During that time frame it had a starting price of $49.25, a high price of $52.27, a low price of $45.67, and a 2/13/2026 price of $48.27. This means that it had a yield of 5.30%, or an average monthly yield of 1.86%. The peak-to-valley is -12.63%. The capital gains were -1.99%. The overall gain/loss (cap gains + yield) is 3.31%, or a gain/loss per month of 1.16%. The average volume since inception was 3,995.
NVIT received a recent dividend of $0.2344 on 2/11/2026. This means the current yield ($0.2344 / $48.27 * weeks/months per year paid) is 25.25%.
[19] YieldMax GOOGL Option Income Strategy ETF [GOOY]
GOOY had total dividends of $13.6296 from 7/28/2023 to 2/13/2026. It has been active for 30.53 months. During that time frame it had a starting price of $20.50, a high price of $20.83, a low price of $10.89, and a 2/13/2026 price of $13.74. This means that it had a yield of 66.49%, or an average monthly yield of 2.18%. The peak-to-valley is -47.72%. The capital gains were -32.98%. The overall gain/loss (cap gains + yield) is 33.51%, or a gain/loss per month of 1.10%. The average volume since inception was 177,219.
GOOY received a recent dividend of $0.0958 on 2/13/2026. This means the current yield ($0.0958 / $13.74 * weeks/months per year paid) is 36.26%.
[20] YieldMax Target 12 Big 50 Option Income ETF [BIGY]
BIGY had total dividends of $7.0880 from 11/21/2024 to 2/13/2026. It has been active for 14.76 months. During that time frame it had a starting price of $50.15, a high price of $54.64, a low price of $40.00, and a 2/13/2026 price of $50.70. This means that it had a yield of 14.13%, or an average monthly yield of 0.96%. The peak-to-valley is -26.79%. The capital gains were 1.10%. The overall gain/loss (cap gains + yield) is 15.23%, or a gain/loss per month of 1.03%. The average volume since inception was 6,501.
BIGY received a recent dividend of $0.5276 on 2/5/2026. This means the current yield ($0.5276 / $50.70 * weeks/months per year paid) is 12.49%.
[21] YieldMax Target 12 Real Estate Option Income ETF [RNTY]
RNTY had total dividends of $4.5394 from 4/17/2025 to 2/13/2026. It has been active for 9.89 months. During that time frame it had a starting price of $50.86, a high price of $53.02, a low price of $48.47, and a 2/13/2026 price of $51.49. This means that it had a yield of 8.93%, or an average monthly yield of 0.90%. The peak-to-valley is -8.58%. The capital gains were 1.24%. The overall gain/loss (cap gains + yield) is 10.16%, or a gain/loss per month of 1.03%. The average volume since inception was 1,614.
RNTY received a recent dividend of $0.4951 on 2/5/2026. This means the current yield ($0.4951 / $51.49 * weeks/months per year paid) is 11.54%.
[22] YieldMax JPM Option Income Strategy ETF [JPMO]
JPMO had total dividends of $11.4504 from 9/12/2023 to 2/13/2026. It has been active for 29.03 months. During that time frame it had a starting price of $20.06, a high price of $22.30, a low price of $13.64, and a 2/13/2026 price of $14.53. This means that it had a yield of 57.08%, or an average monthly yield of 1.97%. The peak-to-valley is -38.83%. The capital gains were -27.57%. The overall gain/loss (cap gains + yield) is 29.51%, or a gain/loss per month of 1.02%. The average volume since inception was 28,965.
JPMO received a recent dividend of $0.0620 on 2/13/2026. This means the current yield ($0.0620 / $14.53 * weeks/months per year paid) is 22.19%.
[23] YieldMax MSFT Option Income Strategy ETF [MSFO]
MSFO had total dividends of $13.4903 from 8/25/2023 to 2/13/2026. It has been active for 29.62 months. During that time frame it had a starting price of $20.18, a high price of $23.48, a low price of $12.55, and a 2/13/2026 price of $12.73. This means that it had a yield of 66.85%, or an average monthly yield of 2.26%. The peak-to-valley is -46.55%. The capital gains were -36.92%. The overall gain/loss (cap gains + yield) is 29.93%, or a gain/loss per month of 1.01%. The average volume since inception was 62,248.
MSFO received a recent dividend of $0.0693 on 2/13/2026. This means the current yield ($0.0693 / $12.73 * weeks/months per year paid) is 28.31%.
[24] YieldMax Universe Fund of Option Income ETFs [YMAX]
YMAX had total dividends of $15.8371 from 1/17/2024 to 2/13/2026. It has been active for 24.89 months. During that time frame it had a starting price of $19.90, a high price of $21.94, a low price of $8.32, and a 2/13/2026 price of $8.46. This means that it had a yield of 79.58%, or an average monthly yield of 3.20%. The peak-to-valley is -62.08%. The capital gains were -57.49%. The overall gain/loss (cap gains + yield) is 22.10%, or a gain/loss per month of 0.89%. The average volume since inception was 1,421,892.
YMAX received a recent dividend of $0.0743 on 2/12/2026. This means the current yield ($0.0743 / $8.46 * weeks/months per year paid) is 45.67%.
[25] YieldMax AI & Tech Portfolio Option Income ETF [GPTY]
GPTY had total dividends of $16.1876 from 1/23/2025 to 2/13/2026. It has been active for 12.69 months. During that time frame it had a starting price of $50.09, a high price of $50.43, a low price of $32.92, and a 2/13/2026 price of $38.68. This means that it had a yield of 32.32%, or an average monthly yield of 2.55%. The peak-to-valley is -34.72%. The capital gains were -22.78%. The overall gain/loss (cap gains + yield) is 9.54%, or a gain/loss per month of 0.75%. The average volume since inception was 37,332.
GPTY received a recent dividend of $0.2328 on 2/12/2026. This means the current yield ($0.2328 / $38.68 * weeks/months per year paid) is 31.30%.
[26] YieldMax AAPL Option Income Strategy ETF [APLY]
APLY had total dividends of $12.4775 from 4/18/2023 to 2/13/2026. It has been active for 33.85 months. During that time frame it had a starting price of $20.20, a high price of $23.02, a low price of $11.72, and a 2/13/2026 price of $12.11. This means that it had a yield of 61.77%, or an average monthly yield of 1.82%. The peak-to-valley is -49.09%. The capital gains were -40.05%. The overall gain/loss (cap gains + yield) is 21.72%, or a gain/loss per month of 0.64%. The average volume since inception was 92,436.
APLY received a recent dividend of $0.1774 on 2/13/2026. This means the current yield ($0.1774 / $12.11 * weeks/months per year paid) is 76.18%.
[27] YieldMax DIS Option Income Strategy ETF [DISO]
DISO had total dividends of $12.8113 from 8/25/2023 to 2/13/2026. It has been active for 29.62 months. During that time frame it had a starting price of $20.16, a high price of $22.69, a low price of $10.59, and a 2/13/2026 price of $11.03. This means that it had a yield of 63.55%, or an average monthly yield of 2.15%. The peak-to-valley is -53.33%. The capital gains were -45.29%. The overall gain/loss (cap gains + yield) is 18.26%, or a gain/loss per month of 0.62%. The average volume since inception was 15,980.
DISO received a recent dividend of $0.0715 on 2/13/2026. This means the current yield ($0.0715 / $11.03 * weeks/months per year paid) is 33.71%.
[28] YieldMax S&P 500 0DTE Covered Call Strategy ETF [SDTY]
SDTY had total dividends of $10.9751 from 2/6/2025 to 2/13/2026. It has been active for 12.23 months. During that time frame it had a starting price of $50.29, a high price of $51.29, a low price of $38.59, and a 2/13/2026 price of $43.04. This means that it had a yield of 21.82%, or an average monthly yield of 1.78%. The peak-to-valley is -24.76%. The capital gains were -14.42%. The overall gain/loss (cap gains + yield) is 7.41%, or a gain/loss per month of 0.61%. The average volume since inception was 10,763.
SDTY received a recent dividend of $0.2650 on 2/12/2026. This means the current yield ($0.2650 / $43.04 * weeks/months per year paid) is 32.02%.
[29] YieldMax Nasdaq 100 0DTE Covered Call Strategy ETF [QDTY]
QDTY had total dividends of $13.1039 from 2/13/2025 to 2/13/2026. It has been active for 12 months. During that time frame it had a starting price of $50.61, a high price of $52.55, a low price of $36.76, and a 2/13/2026 price of $40.55. This means that it had a yield of 25.89%, or an average monthly yield of 2.16%. The peak-to-valley is -30.05%. The capital gains were -19.88%. The overall gain/loss (cap gains + yield) is 6.01%, or a gain/loss per month of 0.50%. The average volume since inception was 11,489.
QDTY received a recent dividend of $0.3163 on 2/12/2026. This means the current yield ($0.3163 / $40.55 * weeks/months per year paid) is 40.56%.
[30] YieldMax XOM Option Income Strategy ETF [XOMO]
XOMO had total dividends of $9.2037 from 8/31/2023 to 2/13/2026. It has been active for 29.43 months. During that time frame it had a starting price of $20.01, a high price of $23.38, a low price of $11.32, and a 2/13/2026 price of $12.99. This means that it had a yield of 46.00%, or an average monthly yield of 1.56%. The peak-to-valley is -51.58%. The capital gains were -35.08%. The overall gain/loss (cap gains + yield) is 10.91%, or a gain/loss per month of 0.37%. The average volume since inception was 42,122.
XOMO received a recent dividend of $0.1934 on 2/13/2026. This means the current yield ($0.1934 / $12.99 * weeks/months per year paid) is 77.42%.
[31] YieldMax BRK B Option Income Strategy ETF [BRKC]
BRKC had total dividends of $5.7786 from 6/5/2025 to 2/13/2026. It has been active for 8.26 months. During that time frame it had a starting price of $49.68, a high price of $50.66, a low price of $42.45, and a 2/13/2026 price of $44.12. This means that it had a yield of 11.63%, or an average monthly yield of 1.41%. The peak-to-valley is -16.21%. The capital gains were -11.19%. The overall gain/loss (cap gains + yield) is 0.44%, or a gain/loss per month of 0.05%. The average volume since inception was 11,105.
BRKC received a recent dividend of $0.1489 on 2/13/2026. This means the current yield ($0.1489 / $44.12 * weeks/months per year paid) is 17.55%.
[32] YieldMax Short N100 Option Income Strategy ETF [YQQQ]
YQQQ had total dividends of $5.5407 from 8/15/2024 to 2/13/2026. It has been active for 17.95 months. During that time frame it had a starting price of $19.64, a high price of $20.55, a low price of $11.79, and a 2/13/2026 price of $12.39. This means that it had a yield of 28.21%, or an average monthly yield of 1.57%. The peak-to-valley is -42.63%. The capital gains were -36.91%. The overall gain/loss (cap gains + yield) is -8.70%, or a gain/loss per month of -0.48%. The average volume since inception was 37,089.
YQQQ received a recent dividend of $0.0630 on 2/13/2026. This means the current yield ($0.0630 / $12.39 * weeks/months per year paid) is 26.44%.
[33] YieldMax Crypto Industry & Tech Port Opt Inc ETF [LFGY]
LFGY had total dividends of $25.2572 from 1/14/2025 to 2/13/2026. It has been active for 12.99 months. During that time frame it had a starting price of $51.25, a high price of $55.11, a low price of $19.83, and a 2/13/2026 price of $21.28. This means that it had a yield of 49.28%, or an average monthly yield of 3.79%. The peak-to-valley is -64.02%. The capital gains were -58.48%. The overall gain/loss (cap gains + yield) is -9.20%, or a gain/loss per month of -0.71%. The average volume since inception was 141,795.
LFGY received a recent dividend of $0.2170 on 2/12/2026. This means the current yield ($0.2170 / $21.28 * weeks/months per year paid) is 53.03%.
[34] YieldMax Dorsey Wright Featured 5 Income ETF [FEAT]
FEAT had total dividends of $20.6653 from 12/17/2024 to 2/13/2026. It has been active for 13.89 months. During that time frame it had a starting price of $49.71, a high price of $50.21, a low price of $18.87, and a 2/13/2026 price of $19.43. This means that it had a yield of 41.57%, or an average monthly yield of 2.99%. The peak-to-valley is -62.42%. The capital gains were -60.91%. The overall gain/loss (cap gains + yield) is -19.34%, or a gain/loss per month of -1.39%. The average volume since inception was 25,417.
FEAT received a recent dividend of $0.2323 on 2/12/2026. This means the current yield ($0.2323 / $19.43 * weeks/months per year paid) is 62.17%.
[35] YieldMax Dorsey Wright Hybrid 5 Income ETF [FIVY]
FIVY had total dividends of $15.3574 from 12/17/2024 to 2/13/2026. It has been active for 13.89 months. During that time frame it had a starting price of $49.78, a high price of $52.51, a low price of $23.65, and a 2/13/2026 price of $24.36. This means that it had a yield of 30.85%, or an average monthly yield of 2.22%. The peak-to-valley is -54.96%. The capital gains were -51.06%. The overall gain/loss (cap gains + yield) is -20.21%, or a gain/loss per month of -1.46%. The average volume since inception was 10,100.
FIVY received a recent dividend of $0.1595 on 2/12/2026. This means the current yield ($0.1595 / $24.36 * weeks/months per year paid) is 34.05%.
[36] YieldMax SMCI Option Income Strategy ETF [SMCY]
SMCY had total dividends of $29.3483 from 9/12/2024 to 2/13/2026. It has been active for 17.03 months. During that time frame it had a starting price of $50.62, a high price of $59.20, a low price of $7.50, and a 2/13/2026 price of $7.69. This means that it had a yield of 57.98%, or an average monthly yield of 3.40%. The peak-to-valley is -87.33%. The capital gains were -84.81%. The overall gain/loss (cap gains + yield) is -26.83%, or a gain/loss per month of -1.58%. The average volume since inception was 684,997.
SMCY received a recent dividend of $0.1322 on 2/13/2026. This means the current yield ($0.1322 / $7.69 * weeks/months per year paid) is 89.39%.
[37] YieldMax GME Option Income Strategy ETF [GMEY]
GMEY had total dividends of $10.1317 from 9/9/2025 to 2/13/2026. It has been active for 5.13 months. During that time frame it had a starting price of $50.43, a high price of $56.15, a low price of $34.94, and a 2/13/2026 price of $35.77. This means that it had a yield of 20.09%, or an average monthly yield of 3.92%. The peak-to-valley is -37.77%. The capital gains were -29.07%. The overall gain/loss (cap gains + yield) is -8.98%, or a gain/loss per month of -1.75%. The average volume since inception was 11,699.
GMEY received a recent dividend of $0.3892 on 2/13/2026. This means the current yield ($0.3892 / $35.77 * weeks/months per year paid) is 56.58%.
[38] YieldMax MARA Option Income Strategy ETF [MARO]
MARO had total dividends of $21.9660 from 12/10/2024 to 2/13/2026. It has been active for 14.1 months. During that time frame it had a starting price of $47.14, a high price of $53.06, a low price of $5.05, and a 2/13/2026 price of $5.87. This means that it had a yield of 46.60%, or an average monthly yield of 3.31%. The peak-to-valley is -90.48%. The capital gains were -87.55%. The overall gain/loss (cap gains + yield) is -40.95%, or a gain/loss per month of -2.90%. The average volume since inception was 184,903.
MARO received a recent dividend of $0.0909 on 2/13/2026. This means the current yield ($0.0909 / $5.87 * weeks/months per year paid) is 80.52%.
[39] YieldMax Ultra Short Option Income Strategy ETF [SLTY]
SLTY had total dividends of $12.2832 from 8/21/2025 to 2/13/2026. It has been active for 5.76 months. During that time frame it had a starting price of $49.96, a high price of $50.47, a low price of $28.74, and a 2/13/2026 price of $29.31. This means that it had a yield of 24.59%, or an average monthly yield of 4.27%. The peak-to-valley is -43.06%. The capital gains were -41.33%. The overall gain/loss (cap gains + yield) is -16.75%, or a gain/loss per month of -2.91%. The average volume since inception was 47,152.
SLTY received a recent dividend of $0.3660 on 2/12/2026. This means the current yield ($0.3660 / $29.31 * weeks/months per year paid) is 64.93%.
[40] YieldMax RBLX Option Income Strategy ETF [RBLY]
RBLY had total dividends of $12.5389 from 7/29/2025 to 2/13/2026. It has been active for 6.49 months. During that time frame it had a starting price of $49.34, a high price of $58.42, a low price of $20.75, and a 2/13/2026 price of $21.83. This means that it had a yield of 25.41%, or an average monthly yield of 3.91%. The peak-to-valley is -64.48%. The capital gains were -55.76%. The overall gain/loss (cap gains + yield) is -30.34%, or a gain/loss per month of -4.67%. The average volume since inception was 12,436.
RBLY received a recent dividend of $0.3174 on 2/13/2026. This means the current yield ($0.3174 / $21.83 * weeks/months per year paid) is 75.61%.
[41] YieldMax DKNG Option Income Strategy ETF [DRAY]
DRAY had total dividends of $11.7922 from 7/15/2025 to 2/13/2026. It has been active for 6.95 months. During that time frame it had a starting price of $50.09, a high price of $53.95, a low price of $17.17, and a 2/13/2026 price of $19.40. This means that it had a yield of 23.54%, or an average monthly yield of 3.39%. The peak-to-valley is -68.17%. The capital gains were -61.27%. The overall gain/loss (cap gains + yield) is -37.73%, or a gain/loss per month of -5.43%. The average volume since inception was 13,380.
DRAY received a recent dividend of $0.2242 on 2/13/2026. This means the current yield ($0.2242 / $19.40 * weeks/months per year paid) is 60.09%.
[42] YieldMax RDDT Option Income Strategy ETF [RDYY]
RDYY had total dividends of $12.4658 from 9/9/2025 to 2/13/2026. It has been active for 5.13 months. During that time frame it had a starting price of $51.29, a high price of $56.57, a low price of $20.46, and a 2/13/2026 price of $21.99. This means that it had a yield of 24.30%, or an average monthly yield of 4.74%. The peak-to-valley is -63.83%. The capital gains were -57.13%. The overall gain/loss (cap gains + yield) is -32.82%, or a gain/loss per month of -6.40%. The average volume since inception was 34,582.
RDYY received a recent dividend of $0.2981 on 2/13/2026. This means the current yield ($0.2981 / $21.99 * weeks/months per year paid) is 70.49%.
[43] YieldMax CRCL Option Income Strategy ETF [CRCO]
CRCO had total dividends of $10.8080 from 9/30/2025 to 2/13/2026. It has been active for 4.46 months. During that time frame it had a starting price of $49.21, a high price of $57.31, a low price of $15.01, and a 2/13/2026 price of $17.23. This means that it had a yield of 21.96%, or an average monthly yield of 4.92%. The peak-to-valley is -73.81%. The capital gains were -64.99%. The overall gain/loss (cap gains + yield) is -43.02%, or a gain/loss per month of -9.65%. The average volume since inception was 42,171.
CRCO received a recent dividend of $0.2306 on 2/13/2026. This means the current yield ($0.2306 / $17.23 * weeks/months per year paid) is 69.59%.
[44] YieldMax MSTR Performance & Distribution Tg 25 ETF [MSST]
MSST had total dividends of $2.2624 from 11/18/2025 to 2/13/2026. It has been active for 2.85 months. During that time frame it had a starting price of $53.14, a high price of $54.29, a low price of $28.30, and a 2/13/2026 price of $35.13. This means that it had a yield of 4.26%, or an average monthly yield of 1.49%. The peak-to-valley is -47.87%. The capital gains were -33.89%. The overall gain/loss (cap gains + yield) is -29.63%, or a gain/loss per month of -10.38%. The average volume since inception was 2,061.
MSST received a recent dividend of $0.1717 on 2/11/2026. This means the current yield ($0.1717 / $35.13 * weeks/months per year paid) is 25.42%.
[45] YieldMax HIMS Option Income Strategy ETF [HIYY]
HIYY had total dividends of $9.0716 from 9/23/2025 to 2/13/2026. It has been active for 4.69 months. During that time frame it had a starting price of $48.32, a high price of $53.97, a low price of $11.91, and a 2/13/2026 price of $12.31. This means that it had a yield of 18.77%, or an average monthly yield of 4.00%. The peak-to-valley is -77.93%. The capital gains were -74.52%. The overall gain/loss (cap gains + yield) is -55.75%, or a gain/loss per month of -11.89%. The average volume since inception was 18,552.
HIYY received a recent dividend of $0.1543 on 2/13/2026. This means the current yield ($0.1543 / $12.31 * weeks/months per year paid) is 65.18%.