

As always, please read our disclaimer.
This post is part of our July Run. 26 sectors, 650+ dividend paying stocks, all for $10/month.

“Data Analysis” is post 31 of 31 in the July run!
End of the July Run
The July run is now complete!
Whew. That was a lot of dividends.
Our next run (“The October Run”) will be in October 2026, covering Third Quarter numbers (July 1 - September 30).
Until then, we will be keeping you up to date on things like Weekly Payers, YieldMax, as well as other companies’ stables of dividend-paying products.
If you haven’t signed up yet for a paid subscription, now is a great time to do so as you will get full access to everything the July Run.
Data Analysis
We thought you might enjoy a few summaries from this current run.
Overall, we covered 653 dividend paying stocks across 26 sectors and indices.
If you take the 589 (non-repeating) stocks and weight them equally, here’s what you get.
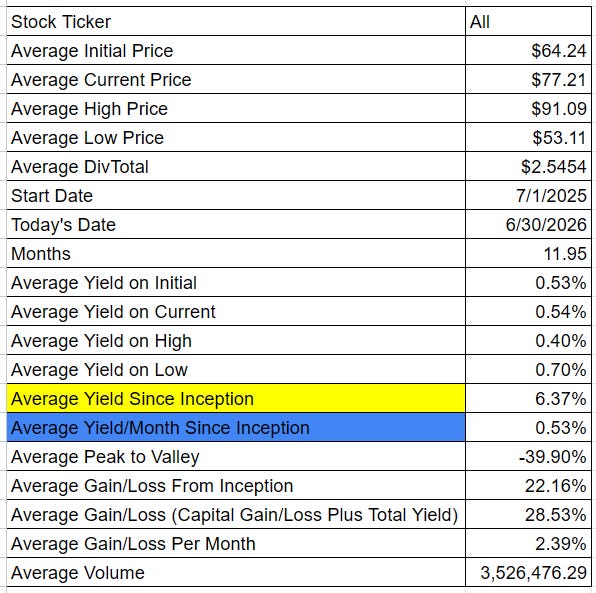
What’s interesting here is that across all 589 of those stocks, you ended up with a 6.37% average yield plus a 22.16% average gain—or a 28.53% average yield + capital gain over the past year. That includes all of the stocks from the “Biggest Losers” list — which had some pretty horrific losses.
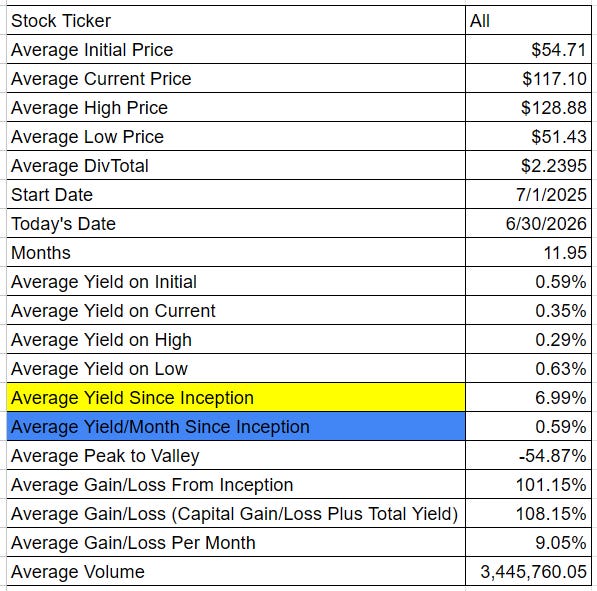
We can trim things down a bit and you can take the Top 100 by Gain:
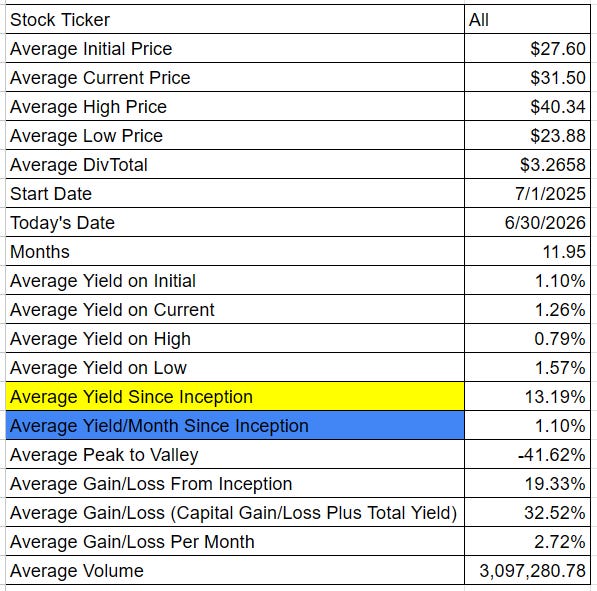
And the Top 100 by Yield:
And you can combine those into a 200 stock portfolio which would have looked like this:
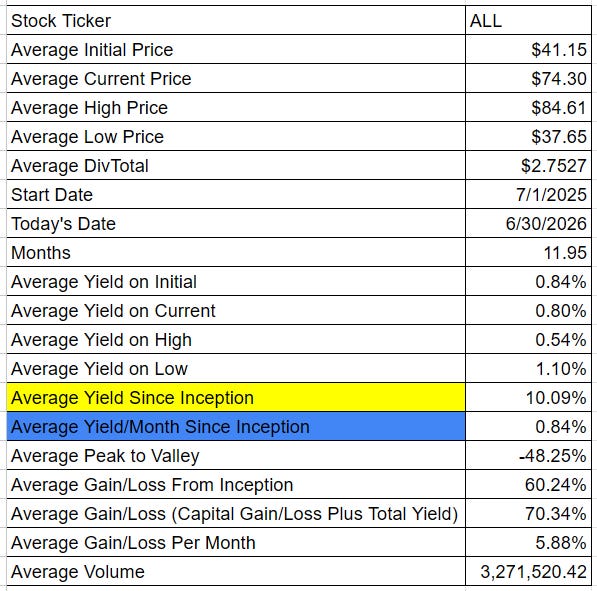
A 70.34% Yield + Capital Gain return, of which 10.09% was yield. Not too shabby.
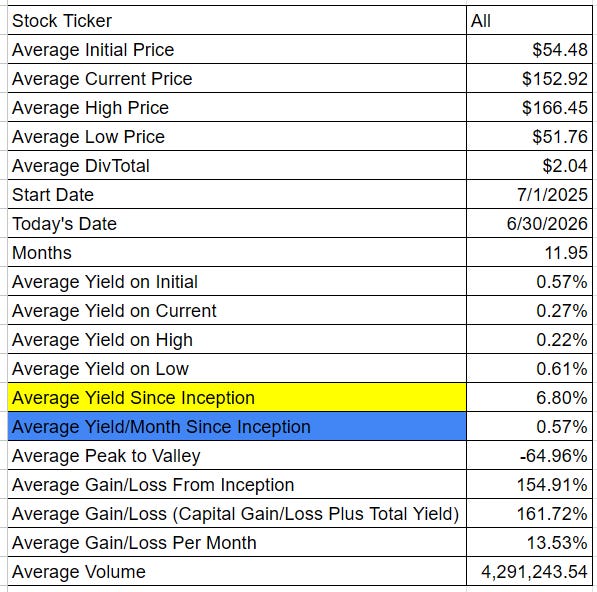
You can trim things down even further to the top 50 by gains:
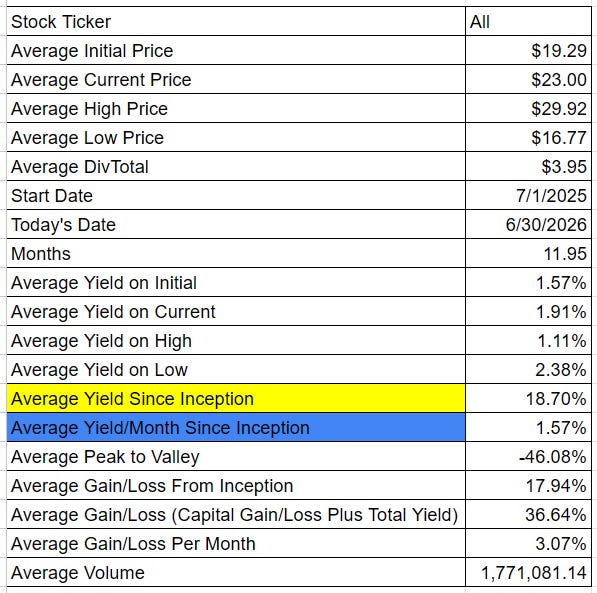
And the top 50 by yield:
And combine those to get a 100 stock blend that looks like this:
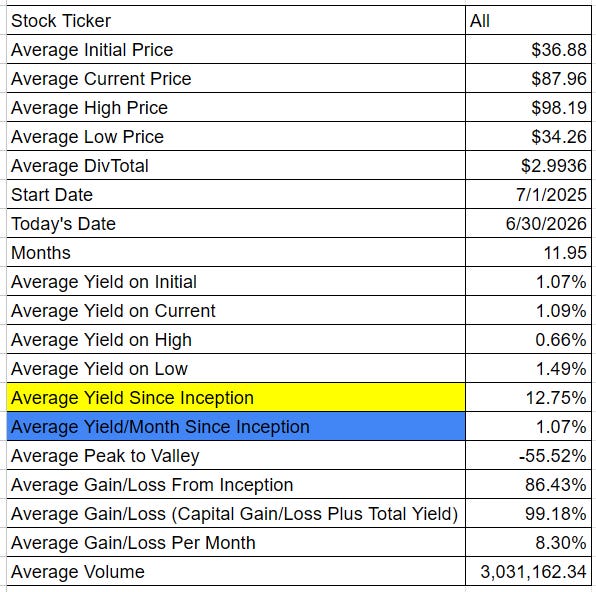
With a 99.18% yield + capital gain, 12.75% of which was yield.
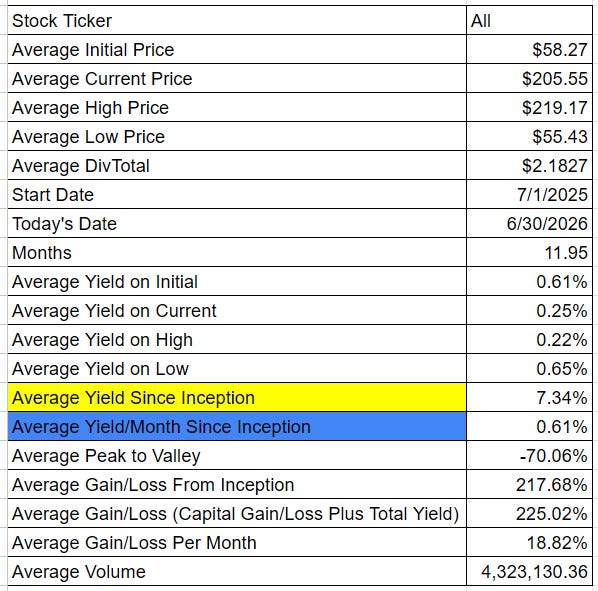
And finally, you can do the same thing with the top 25 by gain:
And the top 25 by yield:
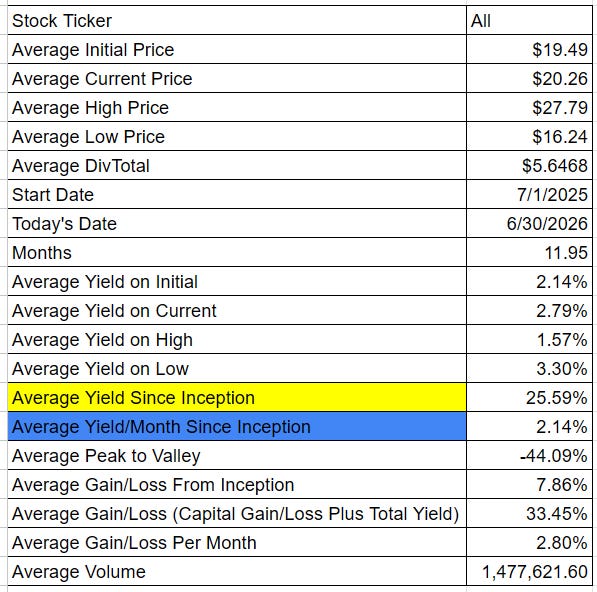
To get a 50 stock blend that looks like this:
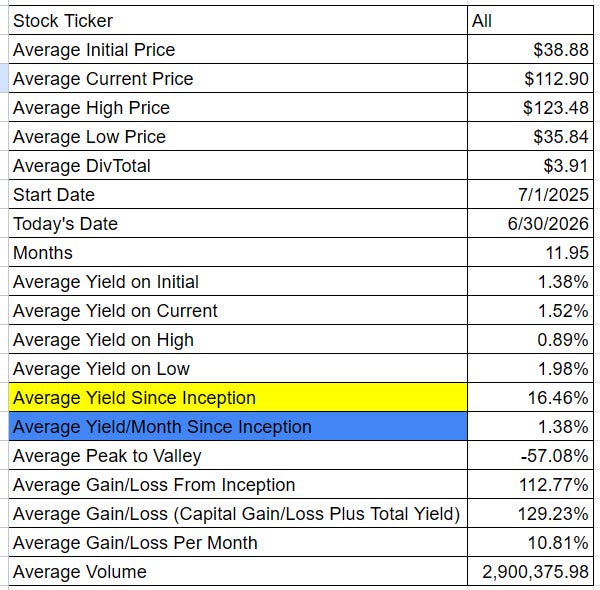
Unfortunately, you wouldn’t have been able to pick all of the top gainers (no one has a crystal ball), so a 50 stock portfolio (top 25 yields + top 25 yield + capital gains) that returned 129.23% in yield + capital gains over the past year is pretty unrealistic.
You wouldn’t have been able to pick all of the top dividend payers either, for the same reason: no one can predict the future.
Still, in that ideal (but unrealistic) scenario, that’s a 129.23% return of which 16.46% is yield.
Or, overall, 10.81% per month in yield + capital gains — using a mix of high returns and high dividend payers.
The key takeaway here is that the universe of dividend paying stocks does provide a kind of interesting lens through which to look at the rest of the market.
And what you’re really after with all of this is creating a “team” of dividend stocks that — metaphorically speaking — can create a 20-win streak, just like the Oakland A’s.
Did the Oakland A’s win the World Series that year? Nope. But that 20-win streak was something no team had ever done before in professional baseball history.
So you might not be able to pick the “perfect” team of dividend stocks that does all the right things — just like you can never pick the “perfect” fantasy football team (note the word “fantasy” in that phrase).
However, with a bit of study — and a bit of luck — you just might pick your own championship team of dividend stocks with the data you find here at Dividend Farmer.
We can’t provide specific investment advice. But the combinations above do provide some further insight into the whole idea that with a bit of research you can create your own dynamic DIY dividend portfolios. Portfolios which can (at least theoretically) beat the pants off the “Big Dogs”…

… and that yes, Moneyball for Dividends might just be a thing.
